
Order a report
Custom-made industry research, company ratings, competitor analysis


The profit level of lessors
The restrictions imposed by the pandemic response put the owners of office and commercial premises in a difficult predicament. The lessors close businesses, go bankrupt or looking for more budget-friendly options.
Information agency Credinform has prepared a ranking to find out which of the lessors have a margin of safety due to the effective work within 2017-2019.
The largest enterprises (TOP-10) in terms of annual revenue were selected according to the data from the Statistical Register and the Federal Tax Service for the available periods (2017-2019). Then the companies were ranged by net profit ratio (Table 1). The company selection and analysis were based on the data from the Information and Analytical system Globas.
Net profit ratio (%) is calculated as a ratio of net profit (loss) to sales revenue. The ratio reflects the company’s level of sales profit.
The ratio doesn’t have the standard value. It is recommended to compare the companies within the industry or the change of a ratio in time for a certain company. The negative value of the ratio indicates about net loss. The higher is the ratio value, the better the company operates.
For the most full and fair opinion about the company’s financial position the whole set of financial indicators and ratios should be taken into account.
| Name, INN, region | Revenue, million RUB | Net profit (loss), million RUB | Net profit ratio, % | Solvency index Globas | |||
| 2018 | 2019 | 2018 | 2019 | 2018 | 2019 | ||
| 1 | 2 | 3 | 4 | 5 | 6 | 7 | 8 |
| LLC BRIZ CONSTRUCTION COMPANY INN 7813188168 St.Petersburg |
|
|
|
|
|
|
208 Strong |
| LLC MEGA BELAYA DACHA INN 5027108265 Moscow region |
|
|
|
|
|
|
197 High |
| LLC MARIYA-RA INN 2225021331 Altai Territory |
|
|
|
|
|
|
179 High |
| LLC ENKA TC INN 7702190316 Moscow |
|
|
|
|
|
|
236 Strong |
| LLC KRASNOBORSKOE INN 7801237357 St.Petersburg |
|
|
|
|
|
|
225 Strong |
| JSC X5 NEDVIZHIMOST INN 7816157915 St.Petersburg |
|
|
|
|
|
|
266 Medium |
| JSC DORINDA INN 7801072391 St.Petersburg |
|
|
|
|
|
|
219 Strong |
| GlavUpDK under the MFA of Russia INN 7704010978 Moscow |
|
|
|
|
|
|
196 High |
| JSC CROCUS INTERNATIONAL INN 7728115183 Moscow region |
|
|
|
|
|
|
266 Medium |
| JSC RN – MAMONTOVO INN 8612008064 Khanty-Mansi Autonomous Okrug- Yugra |
|
|
|
|
|
|
313 Adequate |
| Average value for TOP-10 companies | |
|
|
|
|
|
|
| Avarage indastry value | |
|
|
|
|
|
|
![]() growth of indicator in comparison with prior period,
growth of indicator in comparison with prior period, ![]() decline of indicator in comparison with prior period
decline of indicator in comparison with prior period
The average value of net profit ratio for TOP-10 companies is higher than avarage indastry value. In 2019, seven companies improved the result in comparison with prior period.
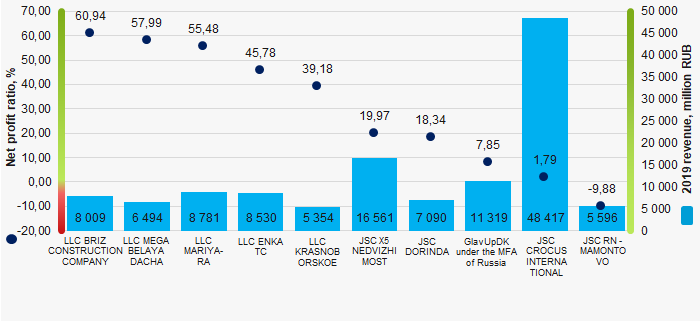 Picture 1. Net profit ratio and revenue of the largest lessors (ТОP-10)
Within 6 years, the average indicators of net profit ratio showed the positive upward trend (Picture 2).
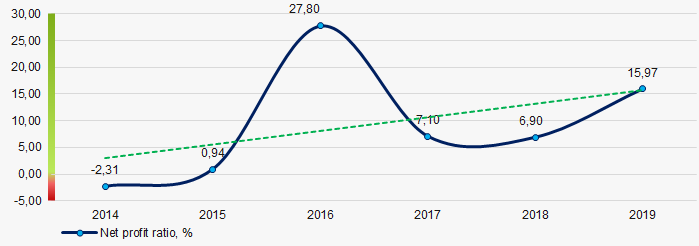 Picture 2. Change in average values of net profit ratio of the lessors in 2014 – 2019