
Order a report
Custom-made industry research, company ratings, competitor analysis


TOP-20 countries accumulate over 80% of global industrial assets
As a rule, GDP (an aggregate performance of all households and companies) is used for analysis of a country’s economy size. Evaluation of economy by assets value of national companies is as much informative. Real economy companies, and not banks, financial corporations and hedge funds, are relevant for this type of analysis. Hence, actual contribution of a country to global industrial production can be estimated.
According to Orbis database (Bureau van Dijk), 2017 resulted in total assets value of industrial companies reaching 258 trillion USD. Assets value speaks of prospective earnings for their owners. The larger the real assets the more significant the role of the country and its residents is.
For reference, nominal global GDP in 2017 amounted to 80,7 trillion USD (World Bank).
China’s total real economy’s assets rank first in the world. Over 18% of industrial assets of over 47 trillion USD are concentrated in China. The USA ranks second, trailing the leader by half: about 12% of global assets are aggregated in the former leading state. The UK rounds out the top three with its 11% of industrial assets (see Table 1).
Russian industrial assets’ estimated value is 5 trillion USD, which puts our country it the 13th place of global ranking.
| Global ranking | Country | Total assets, trillion USD | Share in total global assets, % |
| - | WORLD | 258,3 | 100,0 |
| 1 | China | 47,3 | 18,3 |
| 2 | USA | 30,8 | 11,9 |
| 3 | UK | 28,6 | 11,1 |
| 4 | Japan | 12,1 | 4,7 |
| 5 | Netherlands | 11,4 | 4,4 |
| 6 | Germany | 11,2 | 4,3 |
| 7 | France | 10,2 | 3,9 |
| 8 | Australia | 8,0 | 3,1 |
| 9 | Republic of Korea | 7,8 | 3,0 |
| 10 | Spain | 7,0 | 2,7 |
| 11 | Italy | 6,0 | 2,3 |
| 12 | South Africa | 5,3 | 2,1 |
| 13 | Russia | 5,0 | 1,9 |
| 14 | India | 4,8 | 1,9 |
| 15 | Ireland | 4,4 | 1,7 |
| 16 | Hong Kong | 4,0 | 1,5 |
| 17 | Singapore | 3,4 | 1,3 |
| 18 | Belgium | 3,1 | 1,2 |
| 19 | Brazil | 3,0 | 1,2 |
| 20 | Cayman islands | 2,9 | 1,1 |
| - | Total for Top 20 | 216,4 | 83,8 |
Such countries and territories as Hong Kong, Singapore and the Cayman islands among top 20 indicate these safe harbors’ attractiveness for business registration due to low taxes and ease of registration.
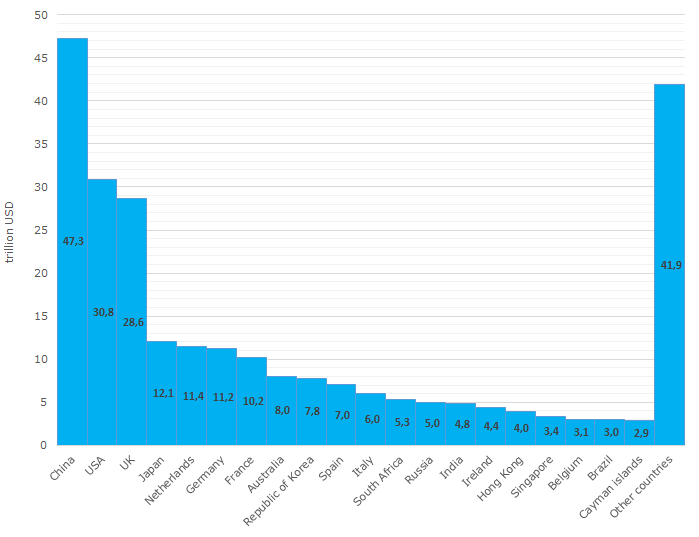 Picture 1. Global industrial assets by countries and territories, trillion USD, 2017
Top 20 countries and territories accumulate over 80% of global industrial assets of total value of 216 trillion USD. Other countries have the rest 17% (see Picture 1), that indicates a high grade of concentration of industrial potential and technology at a certain number of participants of global division of labor.