Top-10 private museums of Moscow
Continuing a series of publications on cultural and historical sites of Russia, the experts of the Information agency Credinform analyzed museums of Moscow.
In the first part of the ranking, the revenues of TOP-10 private museums of Saint Petersburg were examined.
| No. | Name | Revenue in 2019, million RUB |
| 1 | Experimentanium Science Museum | 186,6 |
| 2 | Garage | 125,1 |
| 3 | The Living Systems | 99,1 |
| 4 | Museum Collection | 95,9 |
| 5 | Jewish Museum and Tolerance Center | 76,9 |
| 6 | Bunker 42 | 59,9 |
| 7 | Museum of Russian impressionism | 57,1 |
| 8 | Moscow design museum | 30,9 |
| 9 | Hockey Museum | 13,4 |
| 10 | Bulgakov house | 12,7 |
Experimentanium Science Museum with the highest revenue (186,6 million RUB) is the first in the ranking. The museum provides an interactive exhibition covering all basic fields of science. The visitors can learn in detail not only about electricity, but also about acoustics, magnetism, optics and space.
Garage is ranked the second by revenue (125,1million RUB). It is the first philanthropic institution in Russia to create a comprehensive public mandate for contemporary art. Every year the museum hosts major exhibition projects, as well as retrospectives of the best Russian and foreign artists.
The Living Systems is the third (99,1 million RUB). The museum reveals the secrets of the most complex question about the nature and the structure of living organisms. Unfortunately, the museum is temporarily closed due to COVID-19 restrictions throughout Russia from April to May 2020. Currently, an investor and a new exhibition space are being searched for.
Museum Collection is ranked the fourth (95,9 million RUB). The museum collects over 20 thousand musical carriers and instruments: music boxes, gramophones, accordions, barrel organs, organs, etc. Today the museum has one of the largest private collections in the world.
Then follows the Jewish Museum and Tolerance Center (76,9 million RUB). It is a cultural and educational project dedicating to the history of the Jewish community in Russia since the middle of the 18th century. In addition, it helps people of different cultures, religions and worldviews to communicate with each other. This center is the first of its kind in Russia.
Bunker 42 is the sixth (59,9million RUB). The Military History Museum located at a depth of 65 meters. Former the USSR military-tactical bunker, it was designed to protect against atomic bombings. By the order of Joseph Vissarionovich Stalin, the defense building had to be located in the center of Moscow near the Kremlin. From 1954 to 1986, the bunker was used by the Soviet military command.
Museum of Russian impressionism (57,1 million RUB) is the seventh in the ranking. The museum exhibits works by Russian impressionists. The main exposition includes paintings by the prominent artists Konstantin Korovin, Valentin Serov, Stanislav Zhukovsky, Igor Grabar, etc. The museum considers its mission to popularize Russian art in general and its impressionistic component, both in Russia and abroad. For this, it earned the respect of the international museum community and in 2015 became a member of ICOM (International Council of Museums).
Impressionism is one of the areas of painting that appeared in France at the end of the 19th century. The word “impressionism” comes from the French word "impression". The painters opposed the traditions of classicism and realism. They tried to show beauty and convey emotion from a particular moment. It is interesting that the impressionists never use black color and a palette for mixing paints. Sometimes, they squeeze paint from a tube directly onto the canvas and use small strokes instead of the outlines of the depicted objects.
Moscow design museum (30,9 million RUB) is ranked the eighth. It is the first and only design museum in Russia. The museum collects and stores samples of Russian design from the avant-garde to the present day, as well as the most significant developments of Soviet and Russian designers.
Hockey Museum is the ninth in the ranking (13,4 million RUB). It is the first museum in Russia that is dedicated to the history of Soviet and Russian ice hockey.
The last in the ranking is Bulgakov house (12,7 million RUB). The permanent exhibition of the museum is dedicated to the life and work of Mikhail Afanasyevich Bulgakov.
The ranking results showed that there are many diverse and unique museums in Moscow as well.
TOP-1000 of companies of Kaliningrad region
In order to reduce interregional differences in the level and quality of life of the population, to accelerate the rates of economic growth and technological development, as well as to ensure the national security of the country, the Government of the Russian Federation in February 2019 approved the Strategy for the Spatial Development of Russia until 2025, comprising 12 macro regions. One of them is the Kaliningrad economic region, which includes Kaliningrad region.
Information agency Credinform has prepared a review of trends of the largest companies in Kaliningrad region.
The largest companies (TOP-1000) of the real sector of economy in terms of annual revenue were selected for the analysis according to the data from the Statistical Register and the Federal Tax Service for the latest available periods (2014-2019). The analysis was based on the data of the Information and Analytical system Globas.
Net assets are total assets less total liabilities. This indicator reflects the real value of the property of an enterprise. When the company’s debt exceeds the value of its property, the indicator is considered negative (insufficiency of property).
The largest company in term of net assets is LLC LUKOIL-KALININGRADMORNEFT, INN 3900004998. In 2019, net assets of the organization exceeded 23 billion RUB.
The lowest net assets value among TOP-1000 belonged to JSC BALT NAFTA, INN 3913007474. In 2019, insufficiency of property of the organization was indicated in negative value of -2 billion RUB.
Covering the six-year period, the average net assets values have a trend to increase with the decreasing growth rate (Picture 1).
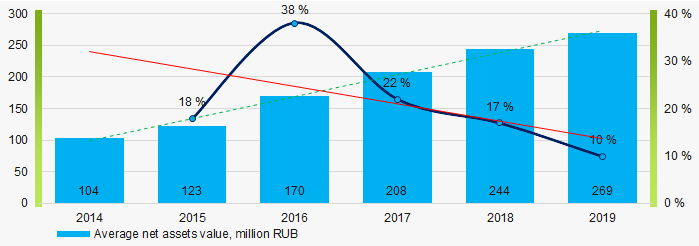 Picture 1. Change in industry average net assets value in 2014 – 2019
Over the past six years, the share of companies with insufficient property had a trend to decrease (Picture 2).
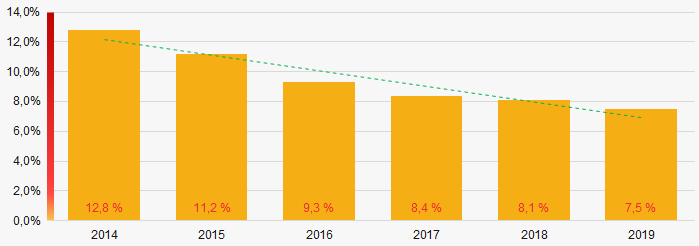 Picture 2. Shares of TOP-1000 companies with negative net assets value
 Sales revenue
In 2019, the revenue volume of 10 largest companies of the industry was 55% of total TOP-1000 revenue (Picture 3). This is indicative of high level of aggregation of capital.
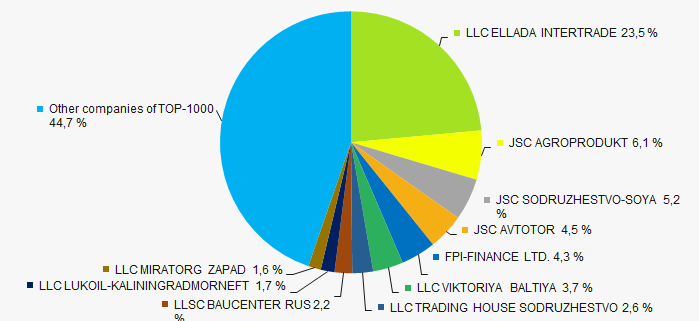 Picture 3. The share of TOP-10 companies in total 2019 revenue of TOP-1000
In general, there is a trend to increase in revenue with increasing growth rate (Picture 4).
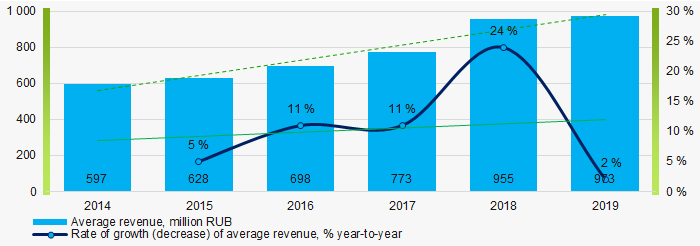 Picture 4. Change in industry average net profit in 2014 – 2019
Profit and loss
The largest organization in term of net profit is JSC AGROPRODUKT, INN 3913501820. The company’s profit for 2019 exceeded 3 billion RUB.
Covering the six-year period, there is a trend to increase in average net profit with the decreasing growth rate (Picture 5).
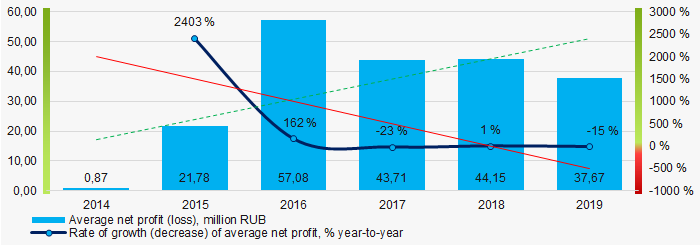 Picture 5. Change in industry average net profit (loss) values in 2014 – 2019
Covering the six-year period, the average net profit values of TOP-1000 have the increasing trend with the decreasing net loss (Picture 6).
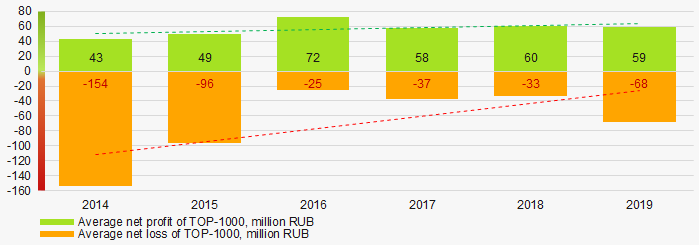 Picture 6. Change in average net profit and net loss of ТОP-1000 in 2014 – 2019
Key financial ratios
Covering the six-year period, the average values of the current liquidity ratio were significantly above the recommended one - from 1,0 to 2,0 with a trend to increase (Picture 7).
Current liquidity ratio (current assets to short-term liabilities) shows the sufficiency of company’s assets to repay on short-term liabilities.
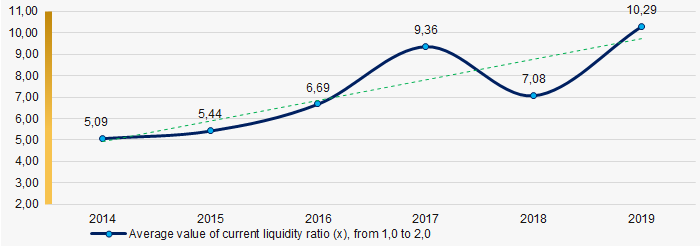 Picture 7. Изменение средних значений коэффициента общей ликвидности компаний ТОП-1000 в 2014 – 2019 годах
Covering the six-year period, the average values of ROI ratio have a trend to decrease (Picture 8).
ROI ratio is calculated as net profit to sum of shareholders equity and long-term liabilities, and shows the return of equity involved in commercial activities and long-term borrowed funds.
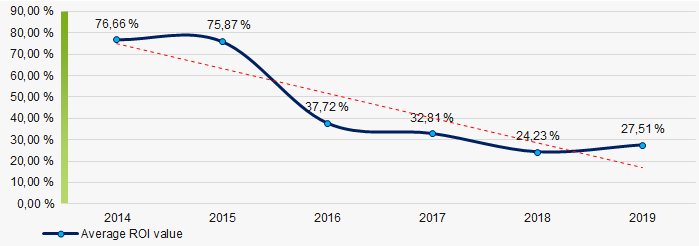 Picture 8. Change in industry average values of ROI ratio in 2014 – 2019
Assets turnover ratio is the ratio of sales revenue and company’s average total assets for a period. It characterizes the effectiveness of using of all available resources, regardless the source of their attraction. The ratio shows how many times per year the full cycle of production and circulation is performed, generating the corresponding effect in the form of profit.
Covering the six-year period, business activity ratio demonstrated the decreasing trend (Picture 9).
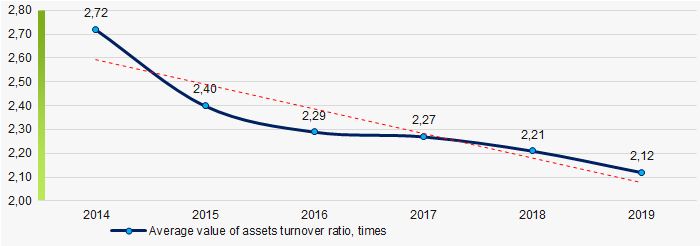 Picture 9. Change in average values of assets turnover ratio in 2014 – 2019
Small business
79% of TOP-1000 organizations are registered in the Register of small and medium-sized enterprises of the Federal Tax Service of the Russian Federation. Their share in total revenue of TOP-1000 is 16% that is almost twice as low as the national average in 2018-2019 (Picture 10).
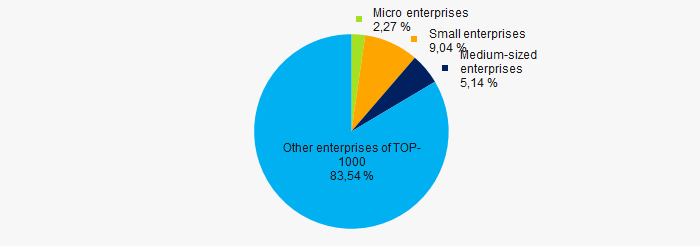 Picture 10. Shares of revenue of small and medium-sized enterprises in TOP-1000
Financial position score
Assessment of the financial position of TOP-1000 companies shows that the majority of them have financial position above average (Picture 11).
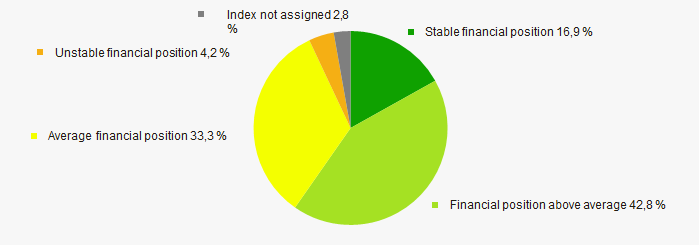 Picture 11. Distribution of TOP-1000 companies by financial position score
Solvency index Globas
Most of TOP-1000 companies got Superior / High and Strong / Medium index Globas. This fact shows their ability to meet their obligations fully (Picture 12).
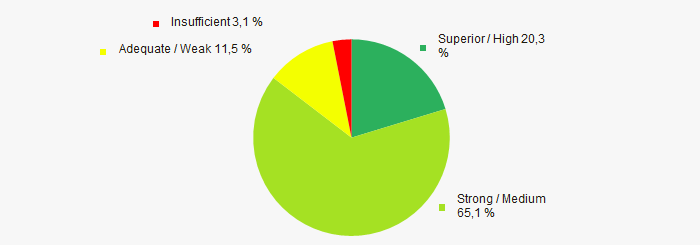 Picture 12. Distribution of TOP-1000 companies by solvency index Globas
Index of industrial production
According to the Federal State Statistics Service, the increasing trend in the industrial production index was recorded for the Kaliningrad economic region during the 12 months of 2019 - 2020 (Picture 13). At the same time, the average indicator of the index month to month of the previous year was 92%.
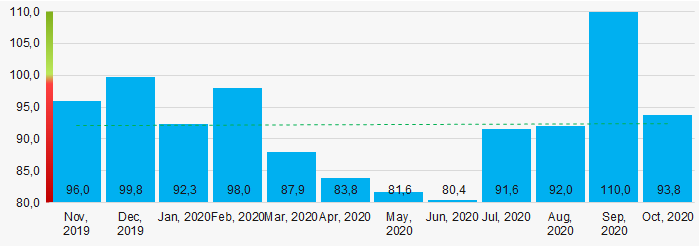 Picture 13. Average index of industrial production in the Kaliningrad economic region in 2019 - 2020, month to month of the previous year (%)
Conclusion
Complex assessment of activity of the largest companies of the real sector of economy in the Kaliningrad economic region, taking into account the main indexes, financial ratios and indicators, demonstrates the prevalence of positive trends (Table 1).
| Trends and evaluation factors | Relative share of factors, % |
| Dynamics of the average net assets value |  10 10 |
| Rate of growth (decrease) in the average size of net assets |  -10 -10 |
| Increase (decrease) in the share of enterprises with negative values of net assets |  10 10 |
| Level of competition / monopolization |  -5 -5 |
| Dynamics of the average revenue |  10 10 |
| Rate of growth (decrease) in the average size of revenue |  10 10 |
| Dynamics of the average profit (loss) |  10 10 |
| Dynamics of the average profit (loss) |  -10 -10 |
| Growth / decline in average values of companies’ net profit |  10 10 |
| Growth / decline in average values of companies’ net loss |  10 10 |
| Increase / decrease in average values of total liquidity ratio |  5 5 |
| Increase / decrease in average values of return on investment ratio |  10 10 |
| Increase / decrease in average values of asset turnover ratio, times |  -10 -10 |
| Share of small and medium-sized businesses in terms of revenue being more than 20% |  -10 -10 |
| Financial position (the largest share) |  10 10 |
| Solvency index Globas (the largest share) |  10 10 |
| Index of industrial production |  -5 -5 |
| Average value of relative share of factors |  3,2 3,2 |
 positive trend (factor),
  negative trend (factor).