
Order a report
Custom-made industry research, company ratings, competitor analysis


TOP-10 companies in terms of net assets value
Information Agency Credinform presents a ranking of net assets value of the largest real economy sector companies of 10 most populated regions of Russia. The companies with the largest volume of annual revenue (TOP-10 and TOP-1000) were selected for the ranking, according to the data from the Statistical Register for the latest available periods (2012 - 2017). Then they were ranked by net assets value (Table 1). The analysis is based on data of the Information and Analytical system Globas.
Net assets is calculated as the difference between balance sheet assets of the enterprise and its debt obligations plus deferred income. There are no recommenmded values for this indicator. It reflects the real value of company's property.
Analysis of the net assets development helps to estimate financial state of the enterprise, solvency and risk level of bankruptcy.
For getting of the most comprehensive and fair picture of the financial standing of an enterprise it is necessary to pay attention to all combination of indicators and financial ratios.
| № in TOP-1000 group, name, INN, region, activity type |
Sales revenue, billion RUB | Net profit (loss), billion RUB | Net assets value, billion RUB | Solvency index Globas | |||
| 2016 | 2017 | 2016 | 2017 | 2016 | 2017 | ||
| 1 | 2 | 3 | 4 | 5 | 6 | 7 | 8 |
| 1 JSC GAZPROM INN 7736050003 Moscow Wholesale of solid, liquid and gas fuel and similar products |
|
|
|
|
|
|
158 Superior |
| 2 JSC SURGUTNEFTEGAS INN 8602060555 Khanty-Mansiysk Autonomous district – Yugra (Tyumen region) Crude oil mining |
|
|
|
|
|
|
185 High |
| 3 LLC GAZPROM MEZHREGIONGAZ INN 5003021311 Saint-Petersburg Wholesale of solid, liquid and gas fuel and similar products |
|
|
|
|
|
|
224 Strong |
| 4 JSC Tatneft INN 1644003838 The Republic of Tatarstan Crude oil and associated petroleum gas mining |
|
|
|
|
|
|
158 Superior |
| 5 JSC Bashneft petroleum company INN 0274051582 The Republic of Bashkortostan Crude oil mining |
|
|
|
|
|
|
199 High |
| 6 JSC MAGNITOGORSK IRON & STEEL WORKS INN 7414003633 Chelyabinsk region Manufacture of iron, steel and ferroalloys |
|
|
|
|
|
|
130 Superior |
| 7 JSC EVRAZ NIZHNY TAGIL METALLURGICAL PLANT INN 6623000680 Sverdlovsk region Manufacture of iron, steel and ferroalloys |
|
|
|
|
|
|
137 Superior |
| 8 JSC CHERNOMORTRANSNEFT INN 2315072242 Krasnodar territory Transportation of oil and oil products by pipelines |
|
|
|
|
|
|
147 Superior |
| 9 JSC T Plus INN 6315376946 Moscow region Electric power producing |
|
|
|
|
|
|
201 Strong |
| 10 ROSTOV HELICOPTER PRODUCTION COMPLEX ROSTVERTOL INN 6161021690 Rostov region Manufacture of helicopters, airplanes and other aircraft vehicles |
|
|
|
|
|
|
167 Superior |
| Total by TOP-10 companies | |
|
|
|
|
|
|
| Average value by TOP-10 companies | |
|
|
|
|
|
|
| Industry average value by TOP-1000 companies | |
|
|
|
|
|
|
| 991 JSC SHIPBUILDING PLANT SEVERNAYA VERF INN 7805034277 Saint-Petersburg Construction of ships, vessels and other floating structures |
|
|
|
|
|
|
271 Medium |
| 992 LLC BASHNEFT-STROY INN 0271006454 The Republic of Bashkortostan Providing other services in the sphere of oil and natural gas mining |
|
|
|
|
|
|
335 Adequate |
| 993 PALMALI CO. LTD INN 6164087026 Rostov region Sea cargo transport activities Process of being wound up since 21.11.2018 |
|
|
|
|
|
|
600 Insufficient |
| 994 JSC Krasnaya polyana INN 2320102816 Krasnodar territory Activities of hotels and other places for part-time residence |
|
|
|
|
|
|
275 Strong |
| 995 LLC REGION-INVEST INN 7733753865 Moscow Investments in securities |
|
|
|
|
|
|
365 Adequate |
| 996 LLC CHELYABINSK TRAKTOR PLANT-URALTRAC LIMITED INN 7452027843 Chelyabinsk region Manufacture of machines and equipment for extraction of minerals and construction |
|
|
|
|
|
|
307 Adequate |
| 997 JSC CROCUS INTERNATIONAL INN 7728115183 Moscow region Lease and management of own or rented inhabited real estate |
|
|
|
|
|
|
260 Strong |
| 998 LLC UMMC-STEEL CORPORATION INN 6606021264 Sverdlovsk region Manufacture of sorted hot-rolled steel and wire |
|
|
|
|
|
|
313 Adequate |
| 999 LLC AGRO - LIGA INN 1650195013 The Republic of Tatarstan Sale of automotive components, parts and accessories |
|
|
|
|
|
|
340 Adequate |
| 1000 JSC YAMAL LNG INN 7709602713 Yamalo-Nenets Autonomous district (Tyumen region) Liquation and benefication of natural gas for further transportation |
|
|
|
|
|
|
245 Strong |
![]() — growth of indicator to the previous period,
— growth of indicator to the previous period, ![]() — decrease of indicator to the previous period.
— decrease of indicator to the previous period.
The average indicator of the net assets value of TOP-10 companies is significantly above the average value of the TOP-1000. In 2017 seven companies out of the TOP-10 have improved their indicators compared to the previous period.
Over a five-year period an increasing tendency in the average values of the net assets ratio in TOP-1000 has been observed. (Picture 2).
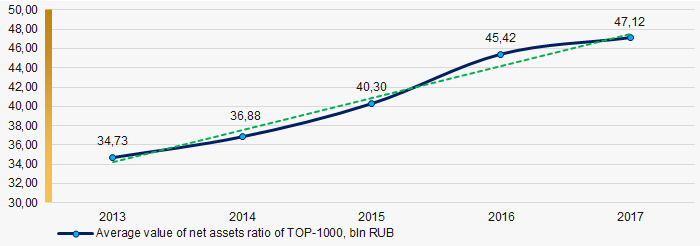 Picture 1. Change of average values of the net assets ratio of TOP-1000 in 2013 – 2017
 Trends in woodworking industry
Information Agency Credinform presents a review of activity trends of the largest Russian woodworking companies.
Woodworking companies with the largest annual revenue (TOP-10 and TOP-1000) have been selected for the analysis, according to the data from the Statistical Register for the latest available accounting periods (2015 — 2017). The analysis was based on the data from the Information and Analytical system Globas.
Net asset value indicates fair value of corporate assets and is calculated annually as assets on balance less company’s liabilities. Net asset value is negative (insufficiency of property) if liabilities are larger than the property value.
| № | Name, INN, region, activity | Net asset value, billion RUB | Solvency index Globas | ||
| 2015 | 2016 | 2017 | |||
| 1 | 2 | 3 | 4 | 5 | 6 |
| 1 | KRONOSPAN LLC INN 5011021227 Moscow region Manufacture of plywood, veneered panels and similar sandwich-type materials, wood-based panels made of wood or other ligneous materials |
14,0 | |
|
205 Strong |
| 2 | EGGER DREVPRODUKT GAGARIN LLC INN 6723019741 Smolensk region Manufacture of plywood, veneered panels and similar sandwich-type materials, wood-based panels made of wood or other ligneous materials |
6,5 | |
|
299 Medium |
| 3 | EGGER DREVPRODUKT SHUYA LLC INN 7704267807 Ivanovo region Manufacture of plywood, veneered panels and similar sandwich-type materials, wood-based panels made of wood or other ligneous materials |
2,2 | |
|
220 Strong |
| 4 | SWISS KRONO LLC INN 4407006010 Kostroma region Manufacture of plywood, veneered panels and similar sandwich-type materials, wood-based panels made of wood or other ligneous materials |
5,4 | |
|
192 High |
| 5 | SYKTYVKAR PLYWOOD MILL LIMITED INN 1121009024 Komi Republic Manufacture of plywood, veneered panels and similar sandwich-type materials, wood-based panels made of wood or other ligneous materials |
2,0 | |
|
185 High |
| 996 | MODERN LUMBER TECHNOLOGY LTD INN 7840322535 Saint Petersburg Manufacture of plywood, veneered panels and similar sandwich-type materials, wood-based panels made of wood or other ligneous materials |
-4,0 | |
|
288 Medium |
| 997 | JSC INDUSTRIAL-WOODWORKING COMPLEX APSHERONSK INN 2325014338 Krasnodar territory Manufacture of lumber, except profiled, more than 6 mm thickness; manufacture of untreated railroad and tram sleepers from wood |
-5,3 | |
|
289 Medium |
| 998 | JSC KRASLESINVEST INN 2460205089 Krasnoyarsk territory Sawmilling and planing of wood |
-7,3 | |
|
279 Medium |
| 999 | TRANS-SIBERIAN FOREST COMPANY LTD INN 3808119644 Irkutsk region Sawmilling and planing of wood Process of being wound up, 18.05.2018 |
-10,9 | |
|
600 Insufficient |
| 1000 | RIMBUNAN HIJAU MDF LLC INN 2721143979 Khabarovsk territory Manufacture of products of wood, cork, straw and plaiting materials |
-12,7 | |
|
311 Adequate |
![]() — growth compared to prior period,
— growth compared to prior period, ![]() — decline compared to prior period.
— decline compared to prior period.
Average net assets of TOP-1000 companies tended to decrease during the last decade (Picture 1).
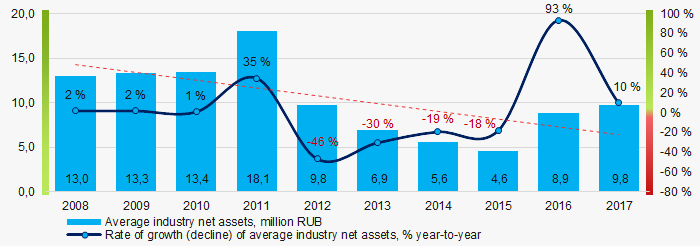 Picture 1. Change in average net assets of woodworking companies in 2008 — 2017
 The share of TOP-1000 companies with insufficiency of property tends to decrease within the last 3 years (Picture 2).
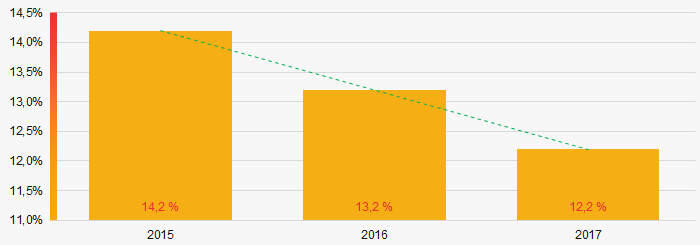 Picture 2. Share of TOP-1000 companies with negative value of net assets in 2015-2017
Sales revenue
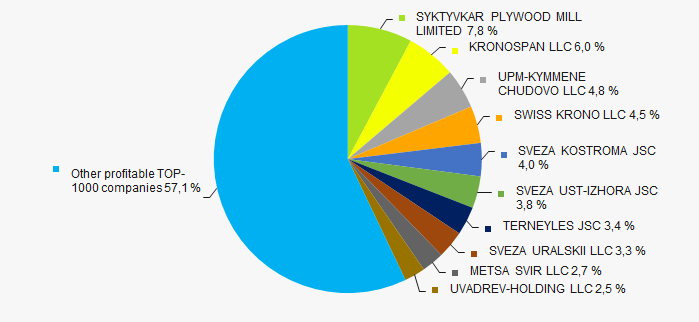
In 2017 sales revenue of 10 leaders amounted to 21% of total revenue of TOP-1000 companies (Picture 3). This is an indicator of a relatively high level of competition within the industry.
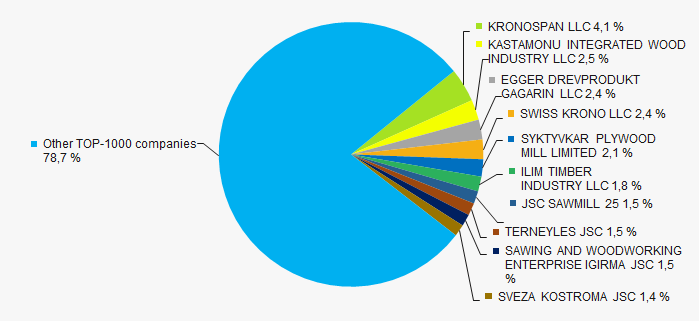 Picture 3. TOP-10 companies by their share in 2017 total revenue of TOP-1000 companies
 In general, average industry revenue tends to decrease during the decade (Picture 4).
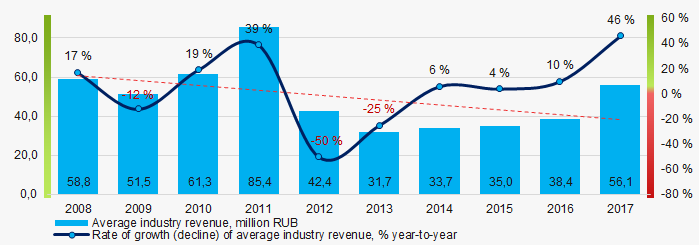 Picture 4. In general, average industry revenue tends to decrease during the decade (Picture 4).
 Profit and loss
n 2017 profit of 10 industry leaders amounted to 43% of total profit of TOP-1000 companies (Picture 5).
 Picture 5. TOP-10 companies by their share in 2017 total profit of TOP-1000
Average net profit has mostly negative values, with a trend of the loss to increase (Picture 6).
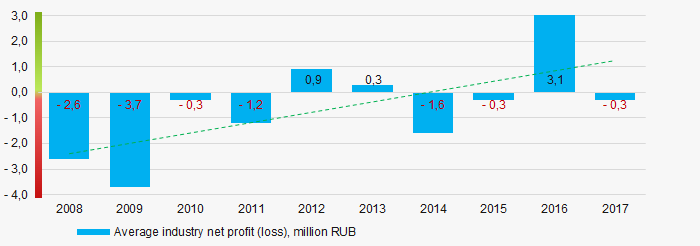 Picture 6. Change in average net profit (loss) of woodworking companies in 2008 — 2017
During the last 3 years average net profit of TOP-1000 companies neither increased nor decreased, with a trend of the loss to decrease (Picture 6).
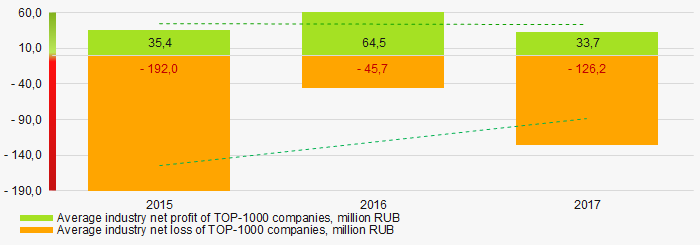 Picture 7. Change in average net profit and loss of TOP-1000 companies in 2015 — 2017
Key financial ratios
During the last decade average values of total liquidity ratio were within the recommended value — from 1,0 to 2,0, tending to increase (Picture 8).
Total liquidity ratio (a ratio of current assets to current liabilities) reveals the sufficiency of a company’s funds for meeting its short-term liabilities.
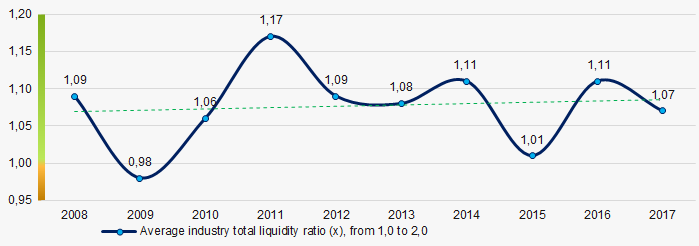 Picture 8. Change in average values of total liquidity ratio of woodworking companies in 2008 — 2017
During the last decade, average values of return on investment ratio were in the negative area, but tending to increase (Picture 9).
It is a ratio of net profit to total equity and noncurrent liabilities, and it demonstrates benefit from equity engaged in business activity and long-term raised funds of the company.
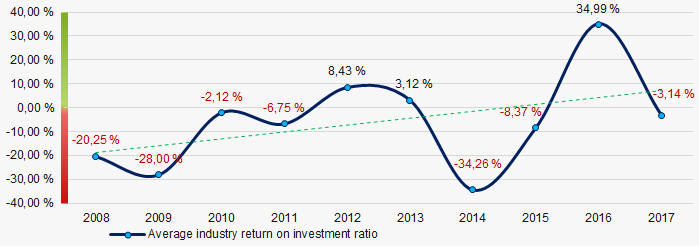 Picture 9. Change in average values of return on investment ratio of woodworking companies in 2008 — 2017
Assets turnover ratio is a ratio of sales revenue to average total assets for the period, and it measures resource efficiency regardless of the sources. The ratio indicates the number of profit-bearing complete production and distribution cycles per annum.
During the decade, this activity ratio tended to increase (Picture 10).
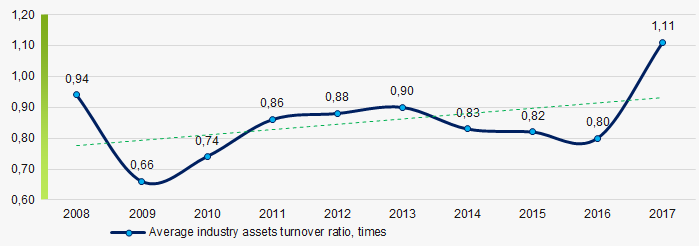 Picture 10. Change in average values of assets turnover ratio of woodworking companies in 2008 — 2017
Activities structure
Manufacture of plywood, veneered panels and similar sandwich-type materials, wood-based panels made of wood or other ligneous materials has the majority share in total revenue of TOP-1000 companies (Picture 11).
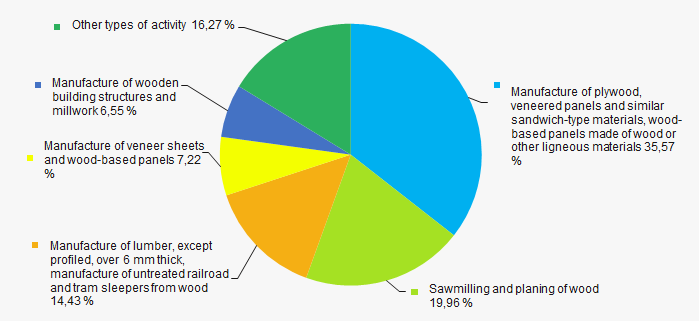 Picture 11. Types of activity by their share in total revenue of TOP-1000 companies
78% of TOP-1000 companies are included in the register of small and medium-sized businesses of the Federal Tax Service of the Russian Federation. In general, their share in total revenue of TOP-1000 in 2017 amounted to 22% (Picture 12).
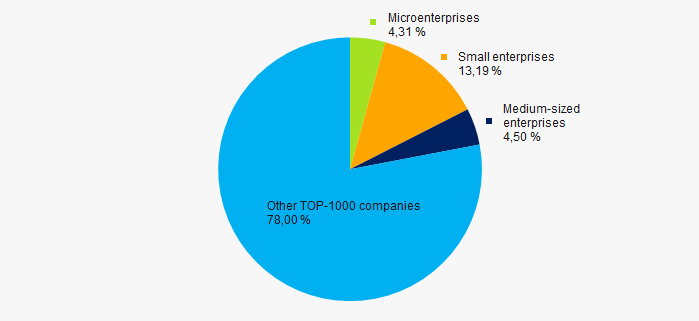 Picture 12. Shares of small and medium-sized enterprises in TOP-1000 companies' revenue, %
Key regions of activity
TOP-1000 companies are unevenly located throughout Russian territory, and are registered in 71 region. Companies with the largest revenue are concentrated in the Irkutsk and Moscow regions (Picture 13).
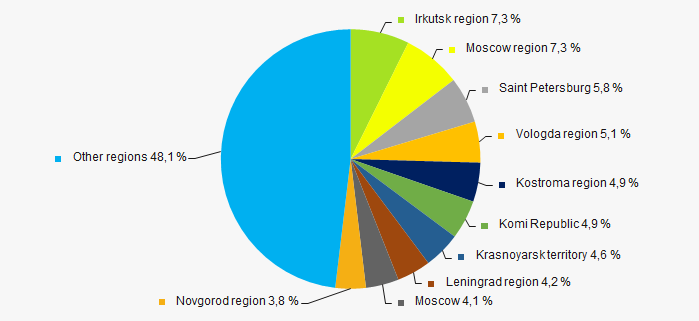 Picture 13. Revenue of TOP-1000 companies by Russian regions
Financial position score
Assessment of financial state of TOP-1000 companies indicates that most of the companies have an average financial standing (Picture 14).
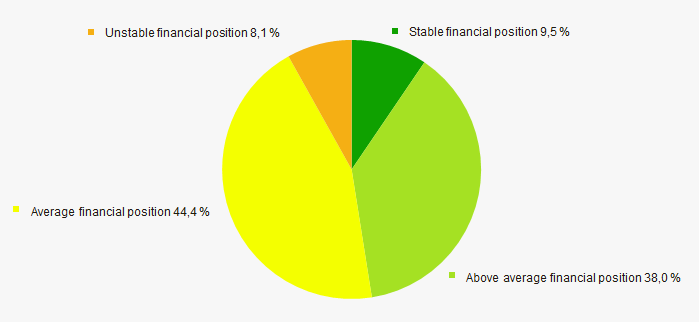 Picture 14. Assessment of financial state of TOP-1000 companies indicates that most of the companies have an average financial standing (Picture 14).
Solvency index Globas
he majority of TOP-1000 companies have got a superior, high, strong or medium Solvency index Globas, that indicates their capability to meet liabilities timely and in full (Picture 15).
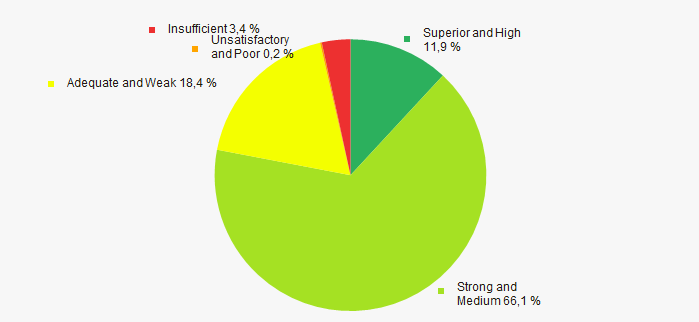 Picture 15. TOP-1000 companies by Solvency index Globas
Index of industrial production
According to the Federal State Statistics Service, during 12 months of 2018 the trend of some decrease of the index of industrial production is observed in the woodworking industry (Picture 16).
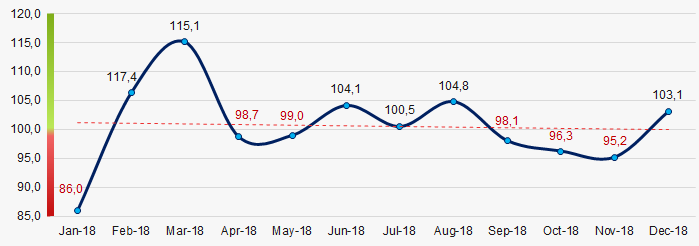 Picture 16. Index of industrial production in woodworking industry in 2018, month-to-month, (%)
Conclusion
A comprehensive assessment of the largest woodworking companies, that considers key indexes, financial figures and ratios, is indicative of predominance of positive trends within the sector (Table 2).
| Trends and assessment factors | Relative share of the factor, % |
| Rate of growth (decline) of average industry net assets | |
| Increase/ Decrease of share of companies with negative net assets | |
| Rate of growth (decline) of average industry revenue | |
| Level of competition / monopolization | |
| Rate of growth (decline) of average industry net profit (loss) | |
| Increase/ Decrease of average industry net profit of TOP-1000 companies | |
| Increase/ Decrease of average industry net loss of TOP-1000 companies | |
| Increase/ Decrease of average industry total liquidity ratio | |
| Increase/ Decrease of average industry return on investment ratio | |
| Increase/ Decrease of average industry assets turnover ratio | |
| Share of small and medium-sized business within the industry by revenue over 30% | |
| Regional concentration | |
| Financial standing (majority share) | |
| Solvency index Glogas (majority share) | |
| Index of industrial production | |
| Average factors' value | |
![]() — positive trend (factor) ,
— positive trend (factor) , ![]() — negative trend (factor).
— negative trend (factor).