
Order a report
Custom-made industry research, company ratings, competitor analysis


More opportunities to travel
According to the results of 2018, the global number of international tourists amounted to 1,4 billion people, 6% exceeding the data of 2017. This is the highest indicator on record. Nearly 20% of global population or every fifth person traveled abroad. Russia is among the most attractive destinations for international tourists.
Main trends in global tourism
Significantly outpacing the global GDP dynamics, tourism is one of the key drivers of the economic development.
Due to growing prosperity, more affordable air transport, tourism digitalization and facilitation of visa regime, the number of foreign travelers will increase year by year that will result in substantial profits for every country. Successful marketing and investment in tourism infrastructure become an integral part of public policy.
The Old World with its rich history and cultural heritage still leads by the number of attracted international tourists: 713 million or 50% of travelers visited Europe in 2018, 6% exceeding the exceptional results of 2017.
International arrivals by countries
According to the preliminary data of the World Tourism Organization, 92 million travelers visited France in 2018 and made the country the global leader. Spain and the USA became the second and the third with 88 million and 80 million tourists respectively. About 26 million travelers visited Russia (see Picture 1). Despite political stereotypes concerning our country, devaluation of rouble coupled with unique nature and great number of historical places make Russia quite attractive for tourism.
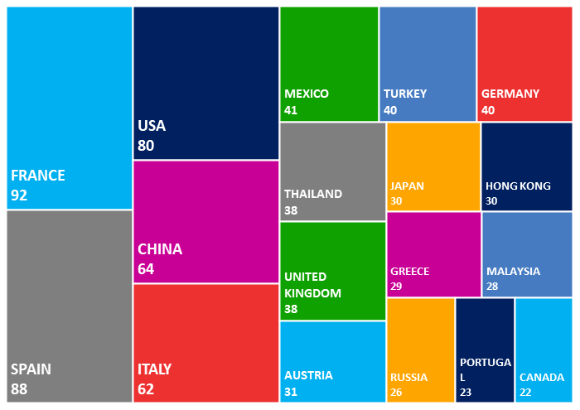 Picture 1. Countries and territories, visited by over 20 million international tourists in 2018
Expenditures of international tourists
Tourists from China lead by expenditures when traveling abroad: 268 billion USD were spent in 2018 – about 20% of global expenditures. Several decades ago, it was difficult to imagine that in a relatively short period Chinese citizens literally occupy all important tourist destinations. Museums, hotels, restaurants and airports began to translate information into Chinese characters.
Based on the rate of the economic growth and population of India, a new mass wave of tourists from this country can be expected in the near future.
In 2018, Russians began to travel a lot again which was resulted in 15,6% increase in expenditures on international tourism - the highest figure among TOP-10 countries (see Table 1).
| № | Country | Expenditures abroad in 2018, billion dollars | Increase to the level of 2017,% |
| 1 | China | 268 | 3,9 |
| 2 | USA | 145 | 7,2 |
| 3 | Germany | 90 | 0,6 |
| 4 | United Kingdom | 74 | 3,5 |
| 5 | France | 46 | 10,3 |
| 6 | Australia | 37 | 8,8 |
| 7 | Russia | 36 | 15,6 |
| 8 | Canada | 33 | 4,0 |
| 9 | Republic of Korea | 32 | 5,7 |
| 10 | Italy | 29 | 2,9 |
Russia as a destination for international tourists
Last year 1,7 million tourists from China visited Russia. Chinese tour groups form up to a quarter of all international tourists except for citizens from post-Soviet countries. High rates of growth are demonstrated by the flow of tourists from the Republic of Korea, the USA, Israel, France and Italy (see Table 2). 2018 FIFA World Cup had affected the popularization of our country.
| № | Country | Tourists arrived in RF in 2018, thousand people | Increase to the level of 2017,% |
| 1 | China | 1 679 | 13,6 |
| 2 | Finland | 938 | -7,8 |
| 3 | Germany | 637 | 9,6 |
| 4 | Poland | 675 | -5,5 |
| 5 | Mongolia | 388 | -2,1 |
| 6 | Republic of Korea | 359 | 41,4 |
| 7 | USA | 334 | 18,6 |
| 8 | Israel | 228 | 21,5 |
| 9 | France | 208 | 12,5 |
| 10 | Italy | 205 | 8,5 |
The most popular destinations among Russian tourists
Turkey is the most popular holiday resort among Russians. Last year 5,6 million people spent their vacations there; that is 25% higher than in 2017 (see Table 3). Finland was visited by 3,4 million people tourists, mainly from Saint Petersburg and Leningrad region.
| № | Country | Russian tourists arrived abroad in 2018, thousand people | Increase to the level of 2017,% |
| 1 | Turkey | 5 623 | 24,4 |
| 2 | Finland | 3 356 | 0,7 |
| 3 | China | 1 965 | -1,9 |
| 4 | Germany | 1 272 | 3,5 |
| 5 | Thailand | 1 173 | 7,2 |
| 6 | Poland | 1 098 | -10,7 |
| 7 | Italy | 1 064 | 19,1 |
| 8 | Spain | 945 | 1,7 |
| 9 | UAE | 941 | 22,8 |
| 10 | Cyprus | 819 | -5,8 |
Tourism sector is an indicator of economic well-being. Slowdown in the global economy, uncertainty surrounding Brexit, geopolitical and trade tensions can induce investors and travelers to take a wait-and-see approach.
Nevertheless, based on current trends, the World Tourism Organization forecasts an increase in international tourists flow from 3% to 4% in 2019. Development of new destinations and diversification of sales markets will continue, especially due to developing Arab countries and India.
By joining the forecast of the World Tourism Organization, we hope the world will become more stable and well-being of travelers will grow, allowing everyone to make many memorable trips!