
Order a report
Custom-made industry research, company ratings, competitor analysis


Companies of chemical industry in Kazan
Information agency Credinform represents a ranking of the largest companies of chemical industry in Kazan. Companies engaged in production of chemicals and chemical products with the largest volume of annual revenue (TOP 10 and TOP 100) were selected for the ranking, according to the data from the Statistical Register and the Federal Tax Service for the latest available periods (2018 - 2020). They were ranked by the equity turnover ratio (Table 1). The selection and analysis were based on the data of the Information and Analytical system Globas.
Equity turnover (times) is the ratio of revenue to the average annual amount of equity capital; it shows the intensity of the enterprise's use of total available assets.
The ratio reflects the rate of turnover of equity capital. A high value of the ratio is indicative of the efficient use of own funds, and a low one is an indicator of the inaction of a part of own funds.
The experts of the Information Agency Credinform, taking into account the actual state of situation both in the economy in general and in the industries, have developed and implemented the calculation of practical values of financial ratios in the Information and Analytical system Globas that can be recognized as normal for a particular industry. For chemical industry enterprises, the practical values of the equity turnover ratio in 2020 ranged from 0 to 14,2 times.
For the most complete and objective view of the financial condition of the enterprise, it is necessary to pay attention to the complex of indicators and financial ratios of the company.
| Name, INN, activity | Revenue, million RUB | Net profit (loss), million RUB | Equity turnover ratio, times | Solvency index Globas | |||
| 2019 | 2020 | 2019 | 2020 | 2019 | 2020 | ||
| 1 | 2 | 3 | 4 | 5 | 6 | 7 | 8 |
| LLC PKF-UPAKOVKA INN 1656060661 manufacture of other chemical products, not elsewhere classified |
|
|
|
|
|
|
277 Medium |
| LLC POLIPAK INN 1658026850 manufacture of plastics and synthetic resins in primary forms |
|
|
|
|
|
|
230 Strong |
| LLC TIOKOM-GERMETIK INN 1657145036 manufacture of paints, varnishes and similar coating materials, printing inks and mastics |
|
|
|
|
|
|
225 Strong |
| LLC KAZAN LIGHT CHEMISTRY PLANT INN 1659157333 manufacture of plastics and synthetic resins in primary forms |
|
|
|
|
|
|
179 High |
| НАО NEFIS COSMETICS - KAZAN CHEMICAL PLANT NAMED AFTER M. VAKHITOV (SOAP AND CANDLE FACTORY NO. 1 FORMER KRESTOVNIKOVS) INN 1653005126 manufacture of soap and detergents, cleaning and polishing products |
|
|
|
|
|
|
225 Strong |
| LLC MASTER CHEMICALS INN 1655142978 production of basic chemicals, fertilizers and nitrogen compounds, plastics and synthetic rubber in primary forms |
|
|
|
|
|
|
187 High |
| JSC AROMAT INN 1653008462 production of perfumery and cosmetics |
|
|
|
|
|
|
198 High |
| LLC EGIDA+ INN 1656018691 manufacture of plastics and synthetic resins in primary forms |
|
|
|
|
|
|
172 Superior |
| LLC TATKHIMPLAST INN 1655217729 manufacture of plastics and synthetic resins in primary forms |
|
|
|
|
|
|
235 Strong |
| KAZAN JSC ORGANIC SYNTHESIS INN 1658008723 manufacture of plastics and synthetic resins in primary forms |
|
|
|
|
|
|
175 High |
| Average value for TOP 10 | |
|
|
|
|
|
|
| Average value for TOP 100 | |
|
|
|
|
|
|
| Average industry value | |
|
|
|
|
|
|
![]() growth of indicator to the previous period,
growth of indicator to the previous period, ![]() fall of indicator to the previous period
fall of indicator to the previous period
The industry average values of the equity turnover ratio of TOP 10 and TOP 100 are above the industry average ones and the practical values. However, only two companies of TOP 10 increased their figures in 2020 compared to 2019. In 2019, the growth was recorded for three companies.
In 2020, six companies included in TOP 10 gained revenue and/or net profit. In general, the industry average revenue climbed at 0,2%, an almost 6% decrease was recorded for TOP 10 and a 5% fall was recorded for TOP 50. The average profit of TOP 10 and TOP 100 fell 16%, and the fall for the industry at average was more than doubled.
Over the past five years, the industry average values of the equity turnover ratio have decreased constantly. The highest value was recorded in 2016 and the lowest one was in 2020 (Picture 1).
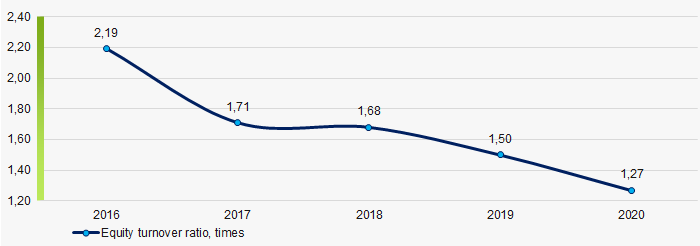 Picture 1. Change in the industry average values of the equity turnover ratio of the companies of chemical industry in 2016 - 2020