
Order a report
Custom-made industry research, company ratings, competitor analysis


TOP 10 software developers
The global software market is constantly growing, driven by companies' intention to invest in their digital sustainability and development. The Russian software market is no exception, where more than 84 thousand development companies are employed, 65% of which are small businesses. The average return on investment of the largest of them in 2020 shows a growing return on equity and long-term borrowed funds. At the same time, revenue and net profit also increased.
Information agency Credinform has selected for this ranking in Globas the largest companies listed in the Unified Register of Small and Medium Enterprises and engaged in the development, modernization, testing and support of software with the highest annual revenue (TOP 10 and TOP 100), according to the data from the Statistical Register and the Federal Tax Service for the latest available periods (2018 – 2020). They were ranked by the return on investment ratio (Table 1).
Return on investment is calculated as the ratio of net profit to the amount of equity capital and long-term liabilities and demonstrates the return on the equity capital involved in commercial activities and the long-term attracted funds of the organization.
For the most complete and objective view of the financial condition of the enterprise, it is necessary to pay attention to the complex of indicators and financial ratios of the company.
| Name, INN, region | Revenue, million RUB | Net profit (loss), million RUB | Return on investment, % | Solvency index Globas | |||
| 2019 | 2020 | 2019 | 2020 | 2019 | 2020 | ||
| 1 | 2 | 3 | 4 | 5 | 6 | 7 | 8 |
| LLC SILIZ INN 7813348809 Saint Petersburg |
|
|
|
|
|
|
152 Superior |
| LLC DOMAIN NAME REGISTER REG.RU INN 7733568767 Moscow |
|
|
|
|
|
|
191 High |
| LLC VS LABORATORY INN 7810840970 Saint Petersburg |
|
|
|
|
|
|
223 Strong |
| LLC SPECIAL TECHNOLOGIES INN 7714343013 Moscow region |
|
|
|
|
|
|
236 Strong |
| LLC PRIME FACTORING INN 7705922670 Moscow |
|
|
|
|
|
|
237 Strong |
| LLC ADV CONSULTING INN 7706127570 Moscow |
|
|
|
|
|
|
216 Strong |
| LLC SCIENTIFIC AND TECHNICAL CENTER PROTEI INN 7825483961 Saint Petersburg |
|
|
|
|
|
|
187 High |
| LLC SATEL INN 7731232881 Moscow |
|
|
|
|
|
|
208 Strong |
| JSC ELVIS-PLUS INN 7735003794 Moscow |
|
|
|
|
|
|
181 High |
| LLC NORBIT INN 7702314674 Moscow |
|
|
|
|
|
|
239 Strong |
| Average value for TOP 10 | |
|
|
|
|
|
|
| Average value for TOP 100 | |
|
|
|
|
|
|
| Average industry value | |
|
|
|
|
|
|
![]() growth of indicator to the previous period,
growth of indicator to the previous period, ![]() fall of indicator to the previous period
fall of indicator to the previous period
The average 2020 value of return on investment ratio of TOP 10 is lower than of TOP 100 and the industry average one. In 2020, the decrease of figures was recorded for three companies of TOP 10. In 2019, the fall was observed in seven companies. The best result was demonstrated by LLC SILIZ engaged in developing and controlling games for social networks.
At the same time, eight companies gained revenue and seven companies gained net profit in 2020.
The increase in revenue was 18% and 8% for TOP 10 and TOP 100 respectively, while the industry average value climbed almost 13%.
The average profit of TOP 10 have increased 36%, TOP 100’s one jumped 34%, and on average in the industry, almost 42% growth was recorded.
In general, the industry average return on investment values have raised for two periods during the past 5 years. The highest value was recorded in 2020 and the lowest one was in 2019 (Picture 1).
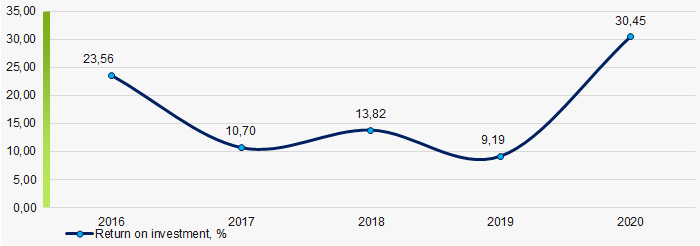 Picture 1. Change in the average return on investment values of software developers in 2016 - 2020