Ranking
Net profit of the largest clothes manufacturers

Information Agency Credinform has prepared the ranking of the largest Russian clothes manufacturers, except companies, engaged in tailoring of special clothes, which is used in industry and military service.

The largest enterprises of the industry in terms of revenue were selected according to the data from the Statistical Register for the latest available period (for the year 2014). The enterprises were ranked by decrease in annual revenue. Total net profit/loss is specified for all companies of the ranking.

Net profit (loss) is a net retained profit (uncovered loss) of the reporting period, remained after income tax and other similar mandatory payments.

In most cases, net profit is used to increase current assets of the enterprise, create funds and reserves and also for reinvesting in production.

Net profit could be considered as a result of company’s activity for a period, in which it was made. The net profit index obviously demonstrates the sum of funds, received after all tax, salary and other statutory payments.

Increase of net profit shows well done work for a certain period and conversely, decrease in indicators and its negative values show the necessity of precautions against bankruptcy.

For the most full and fair opinion about the company’s financial condition, not only the average values of the indicators should be taken into account, but also the whole set of financial indicators and ratios.

Table. Revenue, net profit and solvency index GLOBAS-i® of the largest clothes manufacturers (top-10)
NameRegionRevenue, mln RUB, 2014Net profit / loss, mln RUB, 2014Solvency index GLOBAS-i®
1 CJSC GLORIA JEANS CORPORATION
INN 6166034397
the Rostov region 27 815,8 2 602,1 138
the highest
2 LLC NTO Consult
INN 4207048574
the Kemerovo region 1 245,5 236,6 167
the highest
3 JSC SLAVYANKA
INN 6027014530
the Pskov region 1 047,5 431,2 167
the highest
4 JSC SINAR
INN 5406014187
the Novosibirsk region 845,3 9,0 200
high
5 CJSC Industrial and Commercial Company Elegant
INN 6152001000
the Rostov region 757,1 5,5 222
high
6 CJSC Odejda i moda
INN 3728026176
the Ivanovo region 735,5 10,2 187
the highest
7 OJSC BOLSHEVICHKA
INN 7708029923
Moscow 715,2 117,4 184
the highest
8 LLC Valentin Yudashkin
INN 7730041122
Moscow 609,8 -75,2 282
high
9 LLC BTK Trikotazh
INN 7839476724
Moscow 528,3 168,9 245
high
10 LLC Hosiery-Knitting Factory
INN 2130079012
the Republic of Chuvashia 519,5 0,3 253
high

Net profit volume of the largest clothes manufacturers (top-10) varies from 2602,1 mln RUB (CJSC GLORIA JEANS CORPORATION) to -75,2 mln RUB (LLC Valentin Yudashkin). As it can be seen from the diagram, GLORIA JEANS CORPORATION is the absolute leader in clothes manufacture. The company is significantly ahead of its nearest competitors by annual revenue as well as by net profit.

Clothes manufacturers TOP10

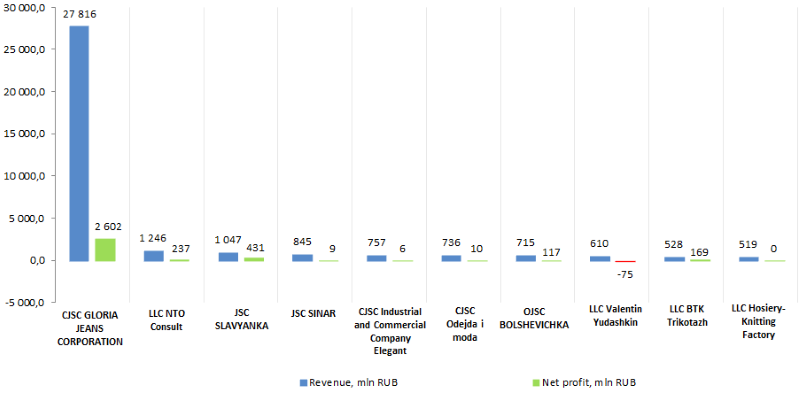
Picture. Revenue and net profit/loss of the largest clothes manufacturers (top-10)

According to the latest financial statements (2014), the annual revenue of market leaders (Top-10) amounted to 34,8 bln RUB, that is 0,3% higher than total revenue of Top-10 companies in 2013. In view of inflation, the marked turnover growth cannot be considered as positive result; the enterprises face with actual market volume reduction in monetary terms.

Despite this, all Top-10 companies of the have the highest and high solvency index, that shows the ability of enterprises to meet their obligations in time and fully; the risk of nonfulfillment is low.

For the last reporting period the net profit of GLORIA JEANS CORPORATION, the leader of the domestic tailoring sphere, increased by 6,3%, from 2,4 bln RUB to 2,6 bln RUB.

GLORIA JEANS is a vertically integrated retailer, the leader of fast fashion segment in Russia and Ukraine.

GLORIA JEANS specializes on design, manufacture and sale of fashion clothes, shoes and accessories for adults and children under Gloria Jeans and Gee Jay trademarks.

The majority of companies on the Russian market purchase products from vendors, offering finished collections. As a rule, they are Hong Kong, Japanese, American and French companies. GLORIA JEANS makes design by itself and has an extensive sourcing department worldwide. Own design and merchandising centers are situated not only in Russia, but also in Sao Paulo, Shanghai, Istanbul and Hong Kong.

Shop network consists of more than 600 stores in Russia and Ukraine. Each of them strengthens the Gloria Jeans brand. According to the McKinsey consulting company, 95% of Russians know the brand.

Ranking
Current liquidity ratio of the largest toys manufacturers

Information Agency Credinform has prepared the ranking of the largest Russian toys manufacturers

Top-10 enterprises, ranged by decrease in revenue, were selected according to the data from the Statistical Register for the latest available period (for the year 2014); the liquidity ratio was calculated for each company (if data are available).

The current liquidity ratio (х) is a ratio of total working capital and short-term liabilities. It shows the sufficiency of funds to repay the obligations, execution date of which comes earlier than 12 months. 

The recommended value: from 1,5 to 2,5. It should be understood, that actual data may significantly vary from the presented normative range for enterprises of different and same industries. 

There are highly liquid, low liquid and illiquid values (assets). The easier and faster you can exchange the asset, taking into account its full cost, the more liquid is the asset. The liquidity of the product is the speed of its implementation using nominal price without additional discounts. 

The ratio shows the ability of the company to meet its current (short-term) obligations using only current assets and characterizes not only company’s current solvency, but also the solvency in case of emergency. The higher is the rate, the better is the solvency of the company.

Both low and high ratios have negative effect. The ratio lower than 1 indicates about high financial risk, which is connected with the fact, that the company is not able to consistently pay its current bills. The ratio more than 3 may testify about the irrational capital structure; overly cautious financial strategy, which may lead to loss of the share in market. However it should be considered, that the ratio value may significantly vary, it depends on the area of activity, structure and quality of the assets etc. 

It should be noted, that the ratio doesn’t always give a full picture. Usually the enterprises, which easily receive money from the payment bills, and with low inventory stocks, may safely operate with a lower ratio value, than the companies with high inventory stocks and sales of goods on credit.

For the most full and fair opinion about the company’s financial condition, not only the average values of the indicators should be taken into account, but also the whole set of financial indicators and ratios.   

Table 1. Revenue, current liquidity ratio and solvency index GLOBAS-i® of the largest toys manufacturers (Top-10)  
NameRegionRevenue, mln. RUB,  2014Current liquidity ratio, (х)Solvency index GLOBAS-i®
1 LLC STELLAR
INN  6165021405
Rostov region 642,8 1,9 190 the highest
2 CJSC STEP PAZZLE
INN  7720249869
Moscow region 633,4 4,2 197 the highest
3 JSC VESNA
INN  4346008642
Kirov region 520,7 17,7 168 the highest
4 LLC Kometa-Plus
INN  6714015660
Smolensk region 412,1 1,6 290 high
5 LLC ZVEZDA
INN  5025025461
Moscow region 386,7 - 337 satisfactory
6 LLC 7-YA
INN  7602033398
Yaroslavl region 374,8 2,8 219 high
7 LLC Hobby World
INN  7708812210
Moscow 278,6 0,9 366 satisfactory
8 LLC FANTAZER
INN  7728557047
Moscow 249,4 1,0 320 satisfactory
9 CJSC Ogonek Plant
INN  7724003577
Moscow 223,9 3,0 229 high
10 LLC Desyatoekorolevstvo
INN  7713321088
Moscow region 195,2 5,8 187 the highest
 
Current liquidity ratio of the largest toys manufacturers (Top-10) varies from 0,9 (LLC Hobby World), to 17,7 (JSC VESNA). And only two companies from the list are within the normative values of the ratio: the leader of the industry LLC STELLAR (1,9) and LLC Kometa-Plus (1,6). These companies have the optimal balance structure in terms of the relation of current assets and short-term liabilities to contractors.
 

the largest toys manufacturers

Picture 1. Current liquidity ratio and revenue of the largest toys manufacturers (Top-10)
 
The leader of Russian market LLC STELLAR started its history in 1994 as a small private firm, all the equipment of which consisted of two injection-molding machines. The main activity of the company was manufacture of plastic products; in particular plastic dishes and racks for CDs and cassettes. 
 
First steps in the development of children's toys domestic market started in 1997 with the manufacture of block constructor and cubes "Alphabet". A year later the main production line was manufacture of plastic children's toys.
 
All products are manufactured according to its own inventions, including the idea, design, appearance, technological preparation. At the moment the company creates the high-precision and high-speed tool for production of plastic toys parts.
 
Today the range of toys, produced by STELLAR, is more than two hundred items. STELLAR is one of the leading companies in the Russian market and widely known in the CIS countries.
Since 2005 the development of the package in the form of toy for the confectionery industry has been started, the patent on manufacture of two-component container in the form of toys for ice cream packaging was acquired. It is possible to package two different products separately from each other.
 
According to the latest financial statements (2014), the annual revenue of market leaders (Top-10) amounted to 3,92 bln. RUB, that is 3,2% higher than total turnover of the largest manufacturers in 2013. The revenue growth didn’t compensate the higher rates of price growth in general within the economy; the manufacturers face with the increase in production costs while reducing of sales profitability.