
Order a report
Custom-made industry research, company ratings, competitor analysis


Product profitability of the largest Russian brewers
Information agency Credinform prepared a ranking of product profitability of the largest Russian brewers. The Russian companies (Top-10) with the highest volume of revenue were selected for this ranking according to the data from the Statistical Register for the latest available periods (2016 and 2015). The enterprises were ranked by decrease in product profitability (see table 1). The analysis was based on data from the Information and Analytical system Globas.
Product profitability is sales revenue to expenses from ordinary activities. Profitability in general indicates the economic efficiency of production. Analysis of product profitability allows to conclude about an output expediency. There is no standard value for profitability indicators, because they change in accordance with the industry the company operates in.
Taking into account the actual situation both in economy in general and in the sector, the experts of the Information agency Credinform have developed and implemented in the Information and Analytical system Globas the calculation of practical values of financial ratios, which can be recognized as normal for a particular industry. The practical value for companies engaged in brewing in 2016 is from 8,61.
For the most complete and objective view of the financial condition of the enterprise it is necessary to pay attention to the complex indicators and financial ratios of the company.
| Name, INN, region | Revenue, mln RUB | Net profit, mln RUB | Product profitability, % | Solvency index Globas | |||
| 2015 | 2016 | 2015 | 2016 | 2015 | 2016 | ||
| 1 | 2 | 3 | 4 | 5 | 6 | 7 | 8 |
| PJSC TOMSKOE PIVO INN 7018011045 Tomsk region |
4 762,4 | 5 095,6 | 1 420,3 | 1 191,7 | 32,14 | 32,44 | 178 High |
| LLC ZAVOD TREKHSOSNENSKIY INN 7302023991 Samara region |
2 470,0 | 6 726,5 | -249,7 | -1 098,5 | 1,17 | 26,25 | 550 Insufficient |
| Baltika Breweries LLC INN 7802849641 Saint-Petersburg |
86 608,4 | 90 525,2 | 12 030,9 | 14 308,2 | 19,70 | 18,59 | 183 High |
| CJSC DEKA INN 5321030165 Novgorod region |
3 244,5 | 4 341,4 | 113,7 | 214,8 | 16,51 | 14,76 | 230 Strong |
| JSC AYAN INN 1901003094 The Republic of Khakassia |
3 288,4 | 3 547,5 | 279,5 | 276,7 | 9,49 | 9,43 | 155 Superior |
| CJSC Moscow beer and alcohol-free plant Ochakovo NN 7729101200 Moscow |
7 514,1 | 8 247,7 | 400,4 | 215,9 | 10,14 | 6,16 | 163 Superior |
| LLC Heineken United Breweries INN 7802118578 Saint-Petersburg |
35 017,1 | 36 852,4 | -1 195,5 | 1 893,7 | 3,97 | 3,62 | 229 Strong |
| CJSC MOSCOW BREWING COMPANY INN 5029104266 Moscow region |
14 910,9 | 17 731,1 | -771,3 | 20,0 | 14,12 | 2,24 | 262 Medium |
| CJSC "Moscow-Efes Brewery" INN 7726260234 Moscow |
35 122,6 | 38 553,0 | -1 366,4 | 1 994,5 | 10,97 | 0,40 | 235 Strong |
| JSC SUN INBEV INN 5020037784 Moscow region |
39 329,0 | 41 662,6 | -9 772,3 | -1 844,1 | -1,89 | -3,29 | 294 Medium |
| Total for TOP-10 | 232 267,4 | 253 283,1 | 889,6 | 17 173,0 | |||
| Average value for TOP-10 companies | 23 226,7 | 25 328,3 | 89,0 | 1 717,3 | 11,63 | 11,06 | |
| Average value for industry | 303,0 | 283,1 | 6,3 | 19,0 | 11,96 | 8,61 | |
Average value of product profitability ratio for the TOP-10 in 2016 is above the practical average. Five companies in TOP-10 have values higher than practical in 2016, four companies – lower, and JSC SUN INBEV has negative value (marked with green, orange and red in columns 6 and 7 of Table 1 respectively). Only two companies in the top of the ranking have increased product profitability figures in 2016 compared to the previous period, or have losses (filled with red in columns 3 and 5 of Table 1).
All Top-10 companies have increased revenue figures in 2016 compared to the previous period; five companies have reduced net profit figures or have losses (filled with green and red in columns 3 and 5 of Table 1 respectively).
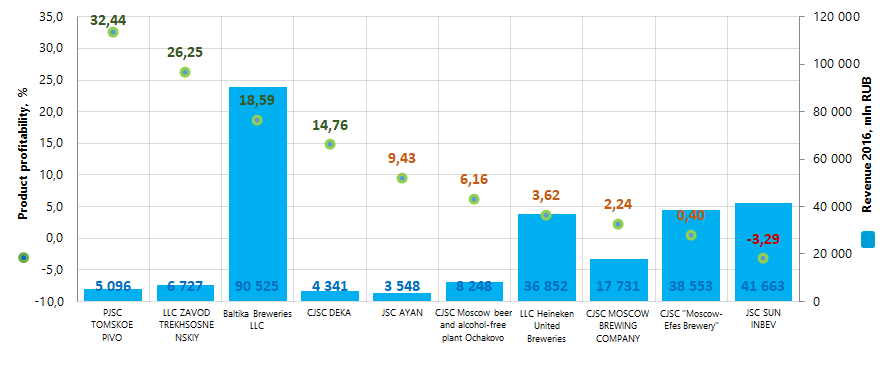 Picture 1. Product profitability and revenue of the largest Russian brewers (TOP-10)
The average industry indicators of product profitability ratio over the past ten years demonstrate trend to reduction. This may indicates a decrease in economic efficiency in this field (Picture 2).
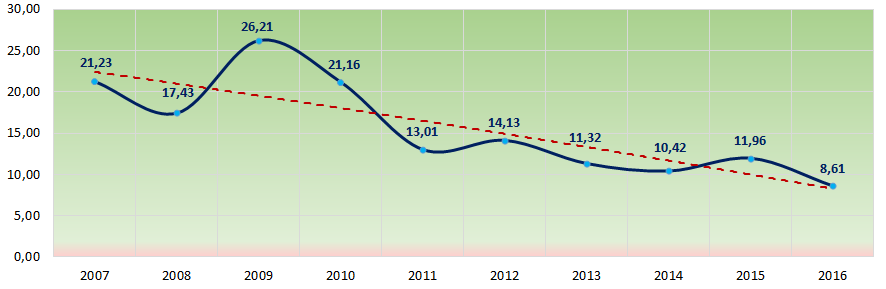 Picture 2. Change in average industry values of product profitability ratio of the Russian brewers in 2007 – 2016
Nine companies in TOP-10 got high, strong, medium and superior indexes Globas, that indicates their ability to timely and fully fulfill debt liabilities.
LLC ZAVOD TREKHSOSNENSKIY has got insufficient Solvency index Globas, due to the bankruptcy case considered against the company and availability of information on unclosed writs of execution. Indexes development forecast is negative.