
Order a report
Custom-made industry research, company ratings, competitor analysis


The largest Russian tool manufacturers on the return on equity ratio
Information agency Credinform Credinform пoffers the ranking of the largest Russian tool manufacturers. The enterprises with the largest volume of revenue (TOP-10 and TOP-100) were selected for the ranking, according to the data from the Statistical Register for the latest available periods (for 2014 and 2015). Then they were ranked by the return on equity ratio in 2015 (Table 1).
Return on equity (%) is calculated as the relation of company’s net profit to its own capital. The ratio determines the efficiency of use of the capital invested by owners of the enterprise and shows the amount of monetary units of net profit earned by each unit invested by them.
This indicator is used by investors and owners of companies to estimate their investments. The higher is the ratio value, the more profitable are investments. If the return on equity is negative or has zero value, it is necessary to analyze reasonability and effectiveness of investments in the enterprise in the future. In such cases the value of the coefficient should be compared with the investment of funds in shares of other companies, bonds or in a bank.
Too high ratio value, in its turn, may have a negative impact on company’s financial stability: more profitability - more risks.
The experts of the Information agency Credinform Credinform, taking into account the actual situation as well in the economy in general as in sectors, have developed and implemented in the Information and Analytical system Globas-i® the calculation of practical values of financial coefficients, which can be recognized as normal for a particular industry. For tool manufacturers the practical value of the solvency ratio is from 7,32%.
For getting of the most comprehensive and fair picture of the financial standing of an enterprise it is necessary to pay attention to all combination of company’s financial indicators and ratios.
| Name, INN, region | Net profit (loss) for 2015, mln RUB | Revenue for 2015, mln RUB | Revenue for 2015 by 2014, % | Return on equity, % | Solvency index Globas-i® |
| URALBURMASH PAOИНН 6646000133 Sverdlovsk region | -424,7 | 633,9 | 13,5 | 181,09 | 307 Satisfactory |
| INSTRUMENT-SERVIS LLC ИНН 5754006620 Orel region | 33,1 | 491,1 | 31,2 | 24,05 | 247 High |
| ZUBR OVK JSC ИНН 5029036344 Moscow region | 29,4 | 647,0 | -32,7 | 22,33 | 223 High |
| BOSCH POWER TOOLS LLC ИНН 6449043071 Saratov region | 275,6 | 3 686,6 | 42,1 | 21,65 | 226 High |
| JSC SANDVIK-MKTC ИНН 7715082847 Moscow | 170,6 | 920,6 | 16,6 | 17,99 | 169 The highest |
| JSC ZBO DRILL INDUSTRIES ИНН 5612002652 Orenburg region | 23,7 | 488,4 | 57,1 | 16,72 | 267 High |
| SATURN - INSTRUMENTALNY ZAVOD NAO ИНН 7610090537 Yaroslavl region | 42,6 | 885,6 | 37,0 | 7,34 | 255 High |
| SEROVSKII MEKHANICHESKII ZAVOD PAO ИНН 6680000479 Sverdlovsk region | 38,4 | 1 045,1 | 9,5 | 2,61 | 167 The highest |
| IZHSTAL-TNP LLC ИНН 1832035310 Udmurt Republic | -5,7 | 608,2 | 7,6 | -11,12 | 290 High |
| INSTRUMENTALNYI ZAVOD - PERMSKIE MOTORY NAO ИНН 5904103714 Perm territory | -11,9 | 886,6 | 12,5 | -34,52 | 300 Satisfactory |
| Total in the group of TOP-10 companies | 171,2 | 10 293,0 | |||
| Total in the group of TOP-100 companies | 818,6 | 23 981,0 | |||
| Average value in the group of TOP-10 companies | 17,1 | 1 029,3 | 20,5 | 24,81 | |
| Average value in the group of TOP-100 companies | 8,2 | 239,8 | 18,8 | 2,11 | |
| Industry average value | 1,3 | 56,6 | -1,0 | 7,32 |
The average value of the return on equity in 2015 in the group of TOP-10 companies and industry average index are higher than practical value, and in the group of TOP-100 enterprises - lower ( are marked with green and red fillings, respectively, in Table 1 and Picture 1). By this, IZHSTAL-TNP LLC and INSTRUMENTALNYI ZAVOD - PERMSKIE MOTORY NAO have negative return on equity ratios.
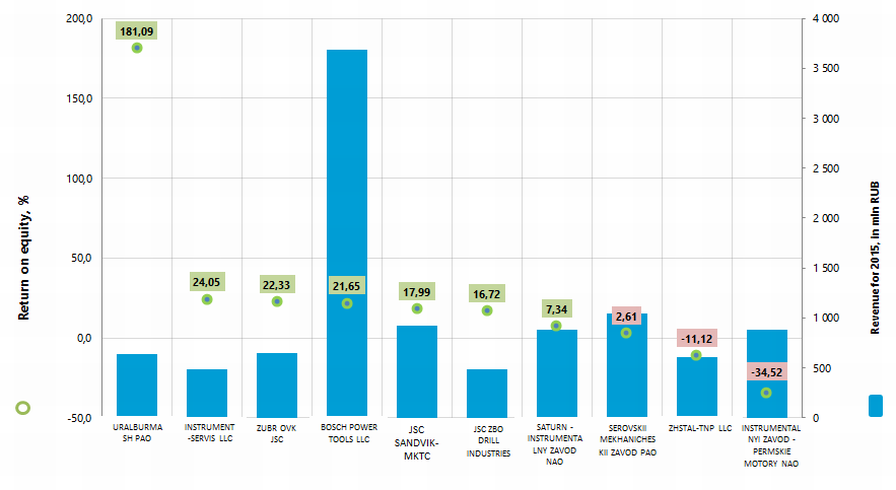 Picture 1. Return on equity ratio and revenue of the largest Russian tool manufacturers (TOP-10)
The volume of revenue of 10 the largest companies made 43% of the total revenue of 100 the largest enterprises in 2015. It points to a relatively high level of competition in the industry. Thus, the volume of revenue of the largest company in the industry, BOSCH POWER TOOLS LLC , made 15% of the total revenue of 100 the largest enterprises, while the rest of companies are several times behind the leader (Picture 2).
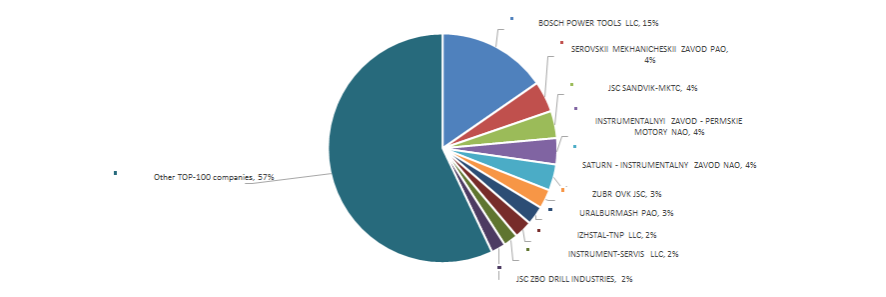 Picture 2. Shares of TOP-10 enterprises in the total revenue of the group of TOP-100 companies for 2015, %
Eight from TOP-10 companies got high solvency index Globas-i®, that points to their ability to repay their debts in time and fully.
URALBURMASH PAO and INSTRUMENTALNYI ZAVOD - PERMSKIE MOTORY NAO got satisfactory solvency indexes Globas-i®, due to the information on their participation as a defendants in arbitration court proceedings in terms of debt collection, cases of untimely fulfillment of obligations, as well as the loss in the structure of balance sheet indicators. The forecast for index development of these companies is stable.
Nine from TOP-10 enterprises increased the indicators of revenue in 2015 compared to the previous period. Four companies reduced the amount of revenue or there is a loss (are marked with red filling in Table 1)
In the group of TOP-100 companies there were 18 loss-making companies in 2014, in 2015 their number decreased to 14. By this, their average loss increased by more than 60% (Picture 3).
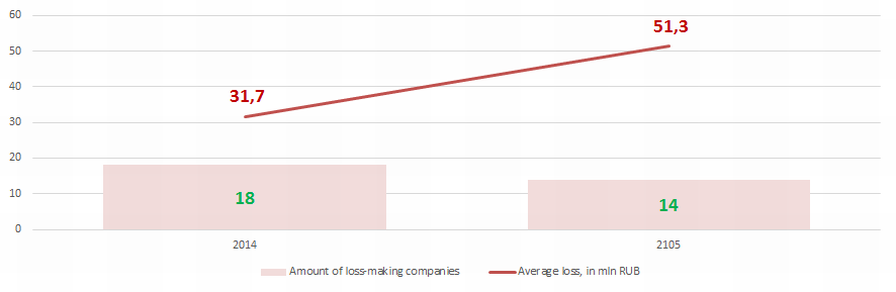 Picture 3. The amount of loss-making companies and their average loss (mln RUB) in the group of TOP-100 enterprises in 2014 – 2015
 In general, industry ratios of the return on equity fit into the parameters of practical value in 2006 - 2013 and in 2015 (Picture 4), that testifies to a relatively high level of investment returns.
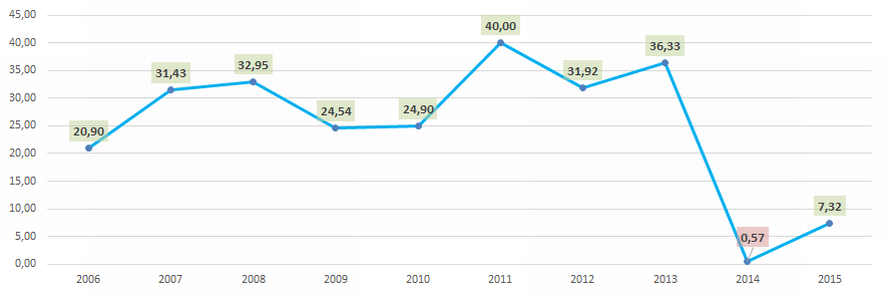 Picture 4. Industry average values of the return on equity ratio of Russian tool manufacturers in 2006 – 2015
 The industry indicators in terms of money are generally not stable, that is confirmed by the data of the Federal State Statistics Service (Picture 5 and Table 2).
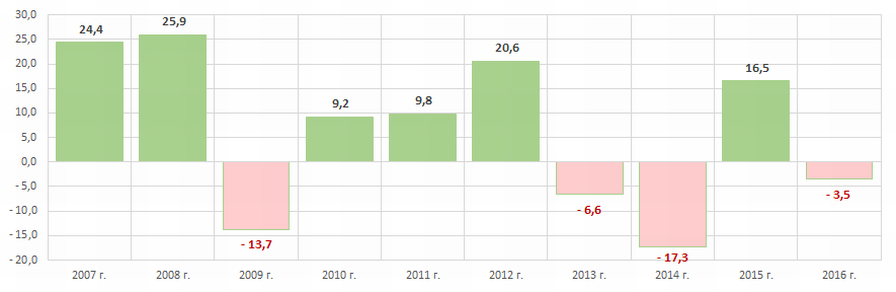 Picture 5. Growth rates (rates of drawdown) of the volume of output of tools in monetary terms, from year to year, %
In the period from 2010 to 2016 the largest volume of tool production was observed in the year 2012. (Table 2).
| 2007 | 2008 | 2009 | 2010 | 2011 | 2012 | 2013 | 2014 | 2015 | 2016 |
| 783,5 | 986,1 | 851,7 | 929,8 | 1 020,8 | 1 230,6 | 1 149,7 | 950,4 | 1 107,3 | 1 068,4 |
*) In Table 2 the red filling marks the decline in the volume of output, green filling – the growth.
The enterprises for tools’ manufacture are distributed unevenly throughout the country. Their greatest concentration is observed in regions, which have the infrastructure and qualified workforce, being relevant for high-tech production. This is confirmed by data of the Information and Analytical system Globas-i®, according to which 100 the largest companies in terms of revenue for 2015 are registered in 34 regions of Russia (Picture 6).
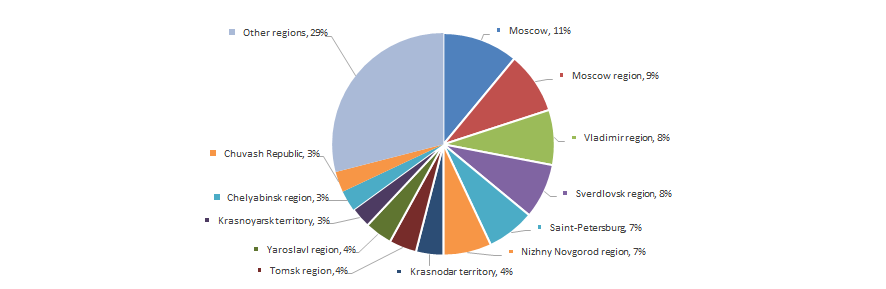 Picture 6. Distribution of 100 the largest tool manufacturers by regions of Russia