
Order a report
Custom-made industry research, company ratings, competitor analysis


Investment efficiency of concrete manufacturers
Information agency Credinform represents a ranking of the largest Russian manufacturers of cement and concrete items. Manufacturers of cement, concrete and building materials with the largest volume of annual revenue (TOP-10) were selected for the ranking, according to the data from the Statistical Register for the latest available periods (2016 - 2018). They were ranked by return on equity ratio (Table 1). The analysis was based on the data of the Information and Analytical System Globas.
Return on equity (ROE) (%) is net income (annual) to shareholder’s equity.
The ratio determines the efficiency of use of capital invested by the owners of the enterprise, and shows the number of monetary units of net profit earned by each unit invested by the owners of the company.
This indicator is used by investors and business owners to measure their own investments. The higher the ratio, the more profitable is the investment. With negative or zero ROE, it is necessary to analyze the feasibility and effectiveness of investments in the future. In such cases, the ratio value should be compared with other investments.
Too high value of the indicatщк can negatively affect the financial stability of the enterprise, since high profitability also implies higher risks.
To obtain the most complete and objective picture of the financial condition of an enterprise, it is necessary to pay attention to the totality of indicators and financial ratios.
For the most complete and objective view of the financial condition of the enterprise, it is necessary to pay attention to the complex of indicators and financial ratios of the company.
| Name, INN, region | Revenue, billion RUB | Net profit (loss), billion RUB | Return on equity, % | Solvency index Globas | |||
| 2017 | 2018 | 2017 | 2018 | 2017 | 2018 | ||
| 1 | 2 | 3 | 4 | 5 | 6 | 7 | 8 |
| Mechel Materials OOO INN 5003064770 Chelyabinsk region |
|
|
|
|
|
|
246 Strong |
| LIMITED LIABILITY COMPANY HENKEL BAUTECHNIK INN 5022031259 Moscow region |
|
|
|
|
|
|
149 Superior |
| Joint Stock Company BetElTrans INN 7708669867 Moscow |
|
|
|
|
|
|
207 Strong |
| RENSTROYDETAL LTD. INN 7806326138 Saint Petersburg |
|
|
|
|
|
|
247 Strong |
| OOO KNAUF GIPS INN 5024051564 Moscow region |
|
|
|
|
|
|
188 High |
| HEIDELBERGCEMENT RUS LIMITED LIABILITY COMPANY INN 5036074848 Moscow region |
|
|
|
|
|
|
242 Strong |
| JSC SEBRYKOVCEMENT INN 3437000021 Volgograd region |
|
|
|
|
|
|
177 High |
| SLK CEMENT LIMITED LIABILITY COMPANY INN 6633028244 Sverdlovsk region |
|
|
|
|
|
|
203 Strong |
| HOLCIM (RUS) CONSTRUCTION MATERIALS LLC INN 5022050558 Moscow region |
|
|
|
|
|
|
255 Strong |
| JSC NOVOROSCEMENT INN 2315020195 Krasnodar territory |
|
|
|
|
|
|
215 Strong |
| Total for TOP-10 companies | |
|
|
|
|
|
|
| Average value for TOP-10 companies | |
|
|
|
|
|
|
![]() growth of indicator to the previous period,
growth of indicator to the previous period, ![]() decrease of indicator to the previous period
decrease of indicator to the previous period
The average indicator of return on sales ratio of TOP-10 companies is below the average of TOP-1000. In 2018, six companies of TOP-10 increased their figures.
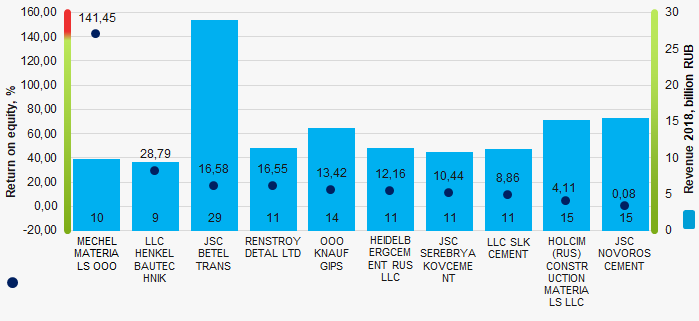 Picture 1. Return on equity ratio and revenue of the largest Russian manufacturers of cement and concrete items (TOP-10)
Over the past 5 years, the average values of return on equity ratio of TOP-1000 have a trend to increase (Picture 2).
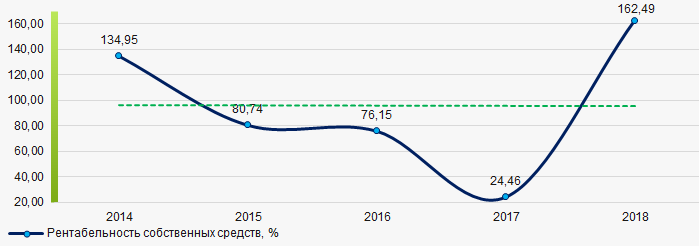 Picture 2. Change in the industry average values of return on equity ratio of TOP-1000 the largest Russian manufacturers of cement and concrete items in 2014 – 2018