Changes in legislation
Addressing to the citizens on April 8, 2020, the President of Russia proposed additional measures to support business.
1. Extend the deferral of payment of insurance premiums to social funds for affected small and medium-sized business for 6 months.
2. Allow to pay tax arrears monthly in equal installments for at least a year after the end of the deferment.
3. To instruct the Government of the Russian Federation to prepare, within 5 days, a program of additional business support with the condition of providing priority assistance to companies that have retained the employment.
Earlier, as a part of measures to support the economy and business, the State Duma of the Russian Federation adopted the Federal Law of 03.04.2020 No. 106-FL “On Amending the Federal Law “On the Central Bank of the Russian Federation (Bank of Russia)”and certain legislative acts of the Russian Federation regarding the peculiarities of changing the terms of a loan agreement” or the so-called “Law on credit holidays".
According to the law, citizens and individual entrepreneurs, as well as small and medium-sized enterprises affected by the coronavirus pandemic, are entitled to credit holidays. The benefit will be valid for 6 months, provided that income is reduced by 30% compared with the average income for 2019. Applications for the benefit are to be applied until September 30. Borrowers are entitled to repay a loan ahead of schedule at any time during the grace period.
The following is not allowed during the grace period:
- charging a penalty, fine or interest;
- requests for advanced fulfillment of obligations;
- foreclosure on collateral or mortgages, as well as claims against the guarantor.
Small and medium-sized enterprises of the sectors most affected by the epidemic, can lot upon credit holidays. The list of these industries is entrusted to be submitted to the Government of the Russian Federation.
In addition, the Government of the Russian Federation prepared the Decree No. 439 of April 03, 2020, concerning measures to support tenants and lessors.
This Decree establishes the conditions for obtaining a deferral of rent under real estate lease agreements. The parties are allowed to agree on holidays or reduction in rent, as well as on other changes to the agreements that do not worsen their situation in comparison with the conditions provided by this Decree.
This applies to real estate owned by state, municipal and private property, except for residential premises.
The effect of the Decree applies to legal entities and individual entrepreneurs whose contracts are valid in 2020 and were concluded before the introduction of the high-alert mode or state of emergency in the region, and if they are included in the List of sectors of the Russian economy that were most affected by the worsening situation as a result of the spread of COVID-19.
Installments are valid until 01.10.2020 starting from the date of the introduction of high-alert mode and state of emergency under the following conditions:
- rent arrears must be paid noе earlier than January 1, 2021 and noе later than January 1, 2023 no more than once a month, in equal installments, the amount of which does not exceed a half of the monthly rent under the lease;
- installment is provided for the duration of the high-alert mode or state of emergency in the territory of the subject in the amount of rent for the corresponding period in the amount of 50% of the rent for the corresponding period from the date of termination of the high-alert mode or state of emergency in the territory of the subject of the Russian Federation until October 1, 2020;
- fines, interest for use of another's money or other measures of responsibility in connection with the tenant's failure to comply with the procedure and deadlines for paying the rent (including if such measures are provided for by the lease agreement) in connection with the delay;
- no additional fee for granting deferral from the tenant.
The Decree contains a reference to the need for supporting measures provision to the lessors having granted a deferral. A list of these measures is likely to be further developed by the Government.
Cereals trading trends
Information agency Credinform represents an overview of activity trends of the largest Russian wholesalers of cereals.
Trading companies with the largest volume of annual revenue (TOP-50) were selected for the analysis, according to the data from the Statistical Register for the latest available periods (for 2013 - 2018). The analysis was made on the basis of the data of the Information and Analytical system Globas.
Net assets value is an indicator, reflecting the real value of company’s property, is calculated annually as the difference between assets on the enterprise balance and its debt obligations. The indicator of net assets is considered negative (insufficiency of property), if company’s debt exceeds the value of its property.
The largest enterprise of the industry in terms of net assets is OPTOVO-ROZNICHNAYA TORGOVAYA I PROIZVODSTVENNAYA FIRMA KUBANYOPTPRODTORG NJSC, INN 2312018180, Krasnodar territory. Its net assets amounted to more than 4 billion rubles in 2018.
The smallest amount of net assets in the TOP-50 list was hold by RICHLINE LLC, INN 7718791016, Moscow. The insufficiency of property of this company in 2018 was expressed as a negative value of -1 billion rubles.
The industry average values of net assets tend to increase over the ten-year period (Picture 1).
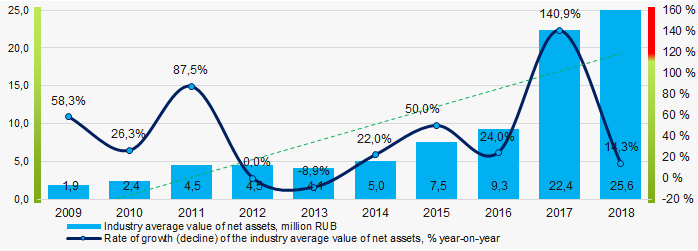 Picture 1. Change in the industry average indicators of the net asset value in 2009 – 2018
The shares of TOP-50 enterprises with insufficiency of assets have a tendency to decrease in the last five years (Picture 2).
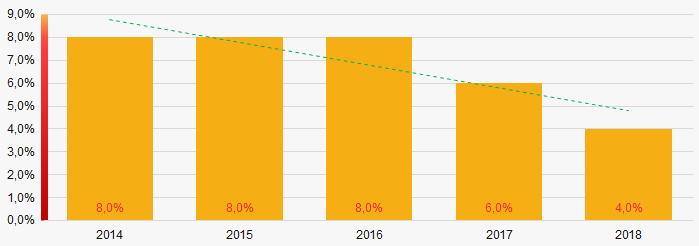 Picture 2. Shares of enterprises with negative values of net assets in TOP-50
Sales revenue
The revenue volume of 10 leading companies of the industry made almost 92% of the total revenue of TOP-50 in 2018 (Picture 3). It points to a high level of monopolization in the industry.
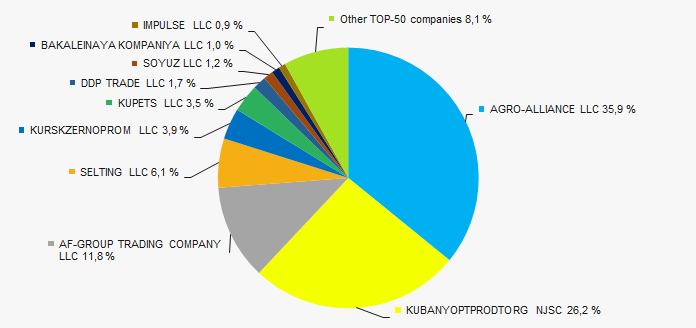 Picture 3. Shares of participation of TOP-10 companies in the total revenue of TOP-50 enterprises for 2018
In general, there is a tendency to increase in the revenue volumes (Picture 4).
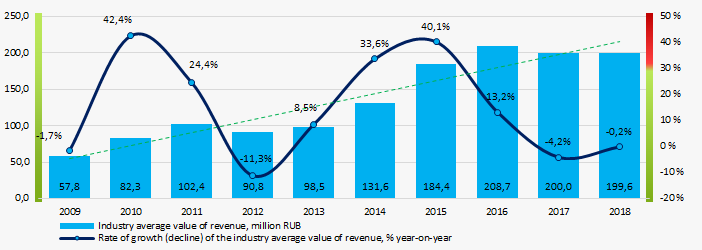 Picture 4. Change in the industry average revenue in 2009 – 2018
Profit and losses
The largest company of the industry in terms of net profit value is also OPTOVO-ROZNICHNAYA TORGOVAYA I PROIZVODSTVENNAYA FIRMA KUBANYOPTPRODTORG NJSC, INN 2312018180, Krasnodar territory. The company's profit amounted to 177 million rubles in 2018.
Over a ten-year period, the indicators of industry average profit have a tendency to increase (Picture 5).
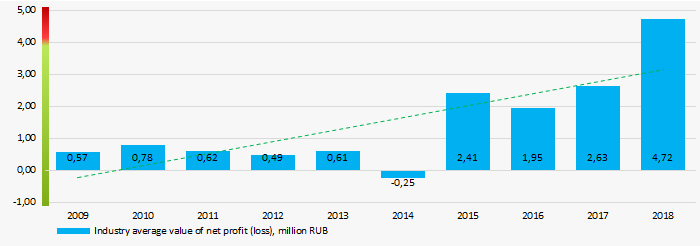 Picture 5. Change in the industry average indicators of profit (loss) in 2009 – 2018
Average values of net profit’s indicators of TOP-50 enterprises have a tendency to decrease over a five-year period, at the same time the average value of net loss increases. (Picture 6).
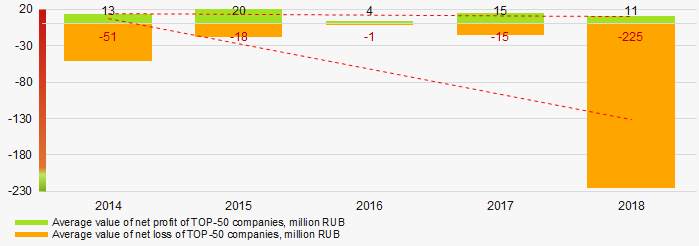 Picture 6. Change in the industry average indicators of net profit and net loss of TOP-50 companies in 2014 – 2018
 Key financial ratios
Over the ten-year period the industry average indicators of the total liquidity were within the range of recommended values - from 1,0 up to 2,0, with a tendency to increase. (Picture 7).
The total liquidity ratio (the relation of the amount of current assets to short-term liabilities) shows the sufficiency of company’s funds for repayment of its short-term liabilities.
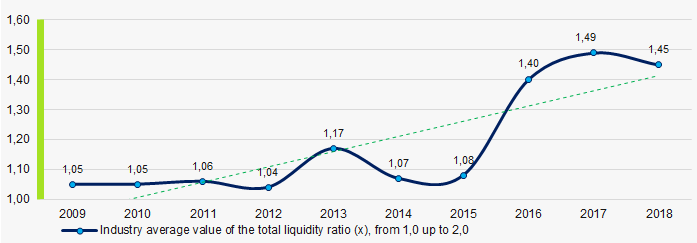 Picture 7. Change in the industry average values of the total liquidity ratio in 2009 – 2018
The industry average values of the return on investment ratio trend to decrease for ten years. (Picture 8).
The ratio is calculated as the relation of net profit to the sum of own capital and long-term liabilities and demonstrates the return on the equity involved in the commercial activity and the long-term borrowed funds of an organization.
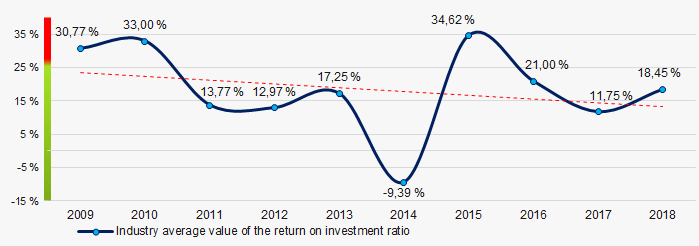 Picture 8. Change in the industry average values of the return on investment ratio in 2009 – 2018
Asset turnover ratio is calculated as the relation of sales proceeds to the average value of total assets for a period and characterizes the efficiency of use of all available resources, regardless of the sources of their attraction. The ratio shows how many times a year a complete cycle of production and circulation is made, yielding profit.
Over a ten-year period, indicators of this ratio of business activity showed an upward trend (Picture 9).
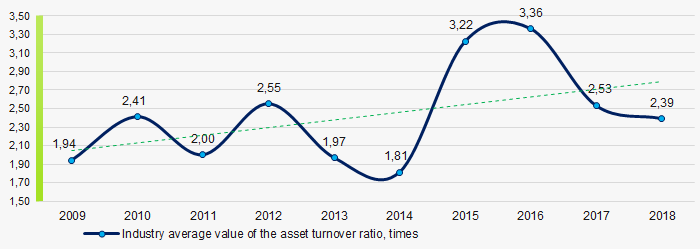 Picture 9. Change in the industry average values of the asset turnover ratio in 2009 – 2018
 Small business
88% of TOP-50 companies are registered in the Register of small and medium-sized enterprises of the Federal Tax Service of the RF. At the same time, their share in the total revenue of TOP-50 enterprises mounts to almost 22%, that is higher than the national average one (Picture 10).
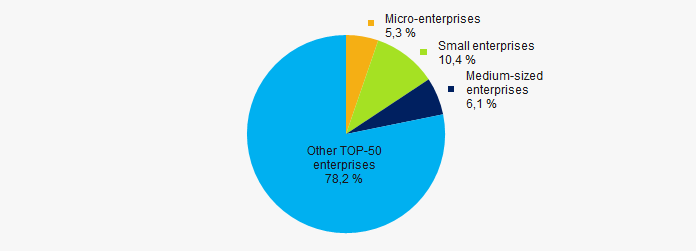 Picture 10. Shares of proceeds of small and medium-sized enterprises in TOP-50 companies
Main regions of activity
The TOP-50 companies are registered in 22 regions and distributed unequal across Russia. More than 75% of the largest enterprises in terms of revenue are concentrated in St. Petersburg, Krasnodar territory and Moscow (Picture 11).
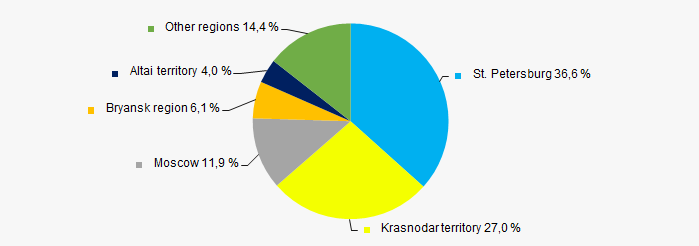 Picture 11. Distribution of the revenue of TOP-50 companies by Russian regions
Financial position score
An assessment of the financial position of TOP-50 companies shows that most of them are in average financial position. (Picture 12).
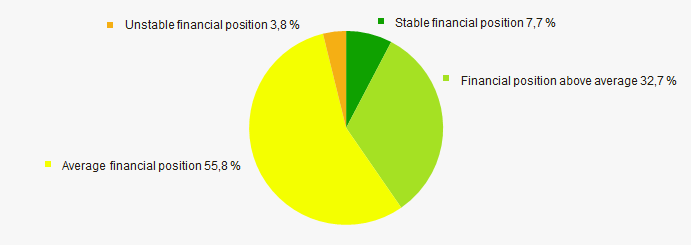 Picture 12. Distribution of TOP-50 companies by financial position score
Solvency index Globas
The most of TOP-50 enterprises got Superior/High or Strong/Medium Solvency index Globas, that points to their ability to pay off their debts in time and fully (Picture 13).
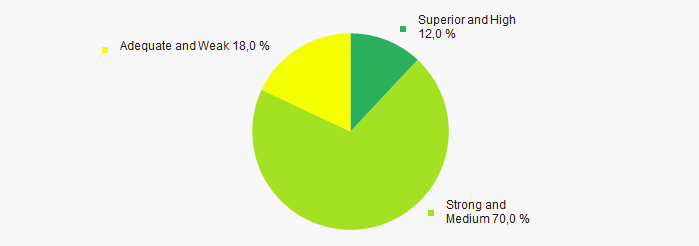 Picture 13. Distribution of TOP-50 companies by solvency index Globas
According to the Federal State Statistics Service, the share of enterprises of the industry in the total revenue volume from the ale of goods, products, works, services made 0,023% countrywide for 2019, that is higher than the indicator for 2018, which amounted to 0,02%.
Conclusion
A comprehensive assessment of activity of the largest Russian wholesalers of cereals, taking into account the main indices, financial indicators and ratios, points to the prevalence of positive trends (Table 1).
| Trends and evaluation factors | Specific share of factor, % |
| Rate of growth (decline) in the average size of net assets |  10 10 |
| Increase / decrease in the share of enterprises with negative values of net assets |  10 10 |
| Level of competition / monopolization |  -10 -10 |
| Rate of growth (decline) in the average size of revenue |  10 10 |
| Rate of growth (decline) in the average size of profit (loss) |  10 10 |
| Growth / decline in average values of net profit of TOP-50 companies |  -10 -10 |
| Growth / decline in average values of net loss of TOP-50 companies |  -10 -10 |
| Increase / decrease in average values of total liquidity ratio |  10 10 |
| Increase / decrease in average values of return on investment ratio |  -10 -10 |
| Increase / decrease in average values of asset turnover ratio, times |  10 10 |
| Share of small and medium-sized enterprises in terms of revenue being more than 21% |  10 10 |
| Regional concentration |  -10 -10 |
| Financial position (the largest share) |  5 5 |
| Solvency index Globas (the largest share) |  10 10 |
| Dynamics of the share of proceeds of the industry in the total revenue of the RF |  10 10 |
| Average value of the specific share of factors |  3,0 3,0 |
 positive trend (factor),
  negative trend (factor).