
Order a report
Custom-made industry research, company ratings, competitor analysis


Changes in legislation in 2022
In 2022 will come into force Federal laws adopted last year and concerning disclosure of data of international companies, usage of a single tax payment, system of public procurement, tourist activities.
The Federal Law No. 100-FZ dated 20.04.2021 made amendments to the Tax code of the Russian Federation. From the 1st of January 2022 international companies operating on the territory of Russia are obliged to disclose data on their shareholders, beneficial owners and managers including information on individuals or public companies directly or indirectly holding 5% or more in the international company.
From the 1st of July to the 31st of December 2022 legal entities and individual entrepreneurs will be able to use a single tax payment. According to the Federal Law No. 379-FZ dated 29.11.2021 , during this period it will be possible to use this special procedure for payment of taxes, dues and fees, insurance fees, penalties and fines by transferring a single tax payment to the Federal treasury account.
From the 1st of January 2022 the Federal Law No.360-FZ dated 02.07.2021 made significant amendments to the Federal Law No.223-FZ dated 18.07.2011 “On procurement of goods, works and services by certain types of legal entities” and the Federal Law No.44-FZ dated 05.04.2013 “On the system of public procurement contracts for goods, works and services for state and municipal needs”.
Federal Law No. 48-FZ dated 24.03.2021 amended the Federal Law "On the Fundamental Principles of Tourist Activities in the Russian Federation". According to the adopted amendments, the Unified Federal Register of Travel Agents and Subagents (the Register) will operate in Russia from the 1st of January 2022.
From the 1st of July 2022 the Federal Law No.64-FZ dated 05.04.2021 introduces the civil liability for non-compliance with the procedure for maintaining the Unified Federal Register of Travel Agents.
TOP 1000 companies of 10 cities with a million-plus population
In Russia there are 15 cities with a million-plus population. During 2021 we have published researches about companies in 10 largest cities with a million-plus population. This publication completes the cycle. Activity analysis of 1000 largest companies demonstrates the prevalence of negative trends in 2016 – 2020.
The most significant of them: increase in the share of enterprises with negative net assets value, high level of capital concentration in the largest companies, decline in values of profit, increase in unprofitableness, and decrease in values of total liquidity and assets turnover ratios. Among the positive trends: growth in average net assets and revenue values, increase in return on investments and high financial stability.
For this activity trends analysis information agency Credinform selected 100 largest companies in terms of annual revenue according to the data from the Statistical Register and the Federal Tax Service for the latest available periods (2015-2020) in 10 (Picture 11) largest cities with a million-plus population in Russia (TOP 1000). The analysis was based on the data of the Information and Analytical system Globas.
Net assets are total assets less total liabilities. This indicator reflects the real value of the property of an enterprise. When the company’s debt exceeds the value of its property, the indicator is considered negative (insufficiency of property).
The largest company in term of net assets is JSC GAZPROM, INN 7736050003, Saint Petersburg, wholesale of solid, liquid and gaseous fuels and related products. In 2020 net assets of the company exceeded 10 trillion RUB.
The lowest net assets value among TOP 1000 belonged to JSC UNITED CHEMICAL COMPANY URALCHEM, INN 7703647595, Moscow, manufacture of fertilizers and nitrogen compounds. Insufficient property figured out negative value -109 billion RUB.
For the five-year period the average net assets values of TOP 1000 tend to increase with decreasing rate of its growth. (Picture 1).
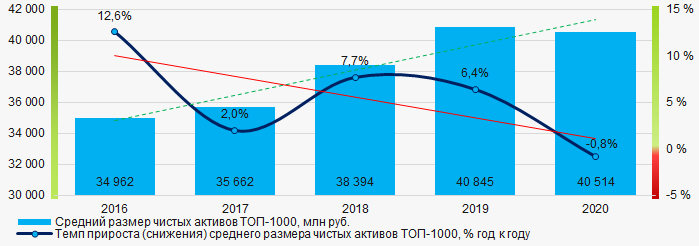 Picture 1. Change in average net assets value of TOP 1000 in 2016– 2020
Shares of the companies with insufficient property had a negative trend to increase. (Picture 2).
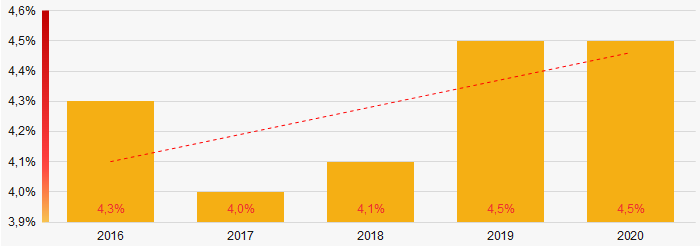 Picture 2. Shares of TOP 1000 companies with negative net assets value in 2016-2020
Sales revenue
In 2020, the revenue volume of the ten largest companies was about 40% of total TOP 1000 revenue (Picture 3). This indicates a high level of capital concentration in the largest companies.
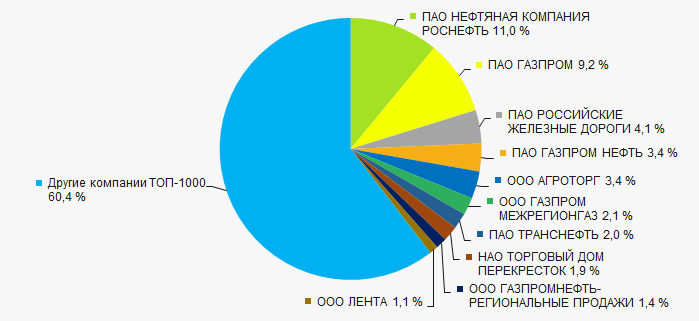 Picture 3. The share of TOP 10 companies in total 2020 revenue of TOP 1000
 For five years average revenue values of TOP 100 increase with decreasing rates of its growth with every year. (Picture 4).
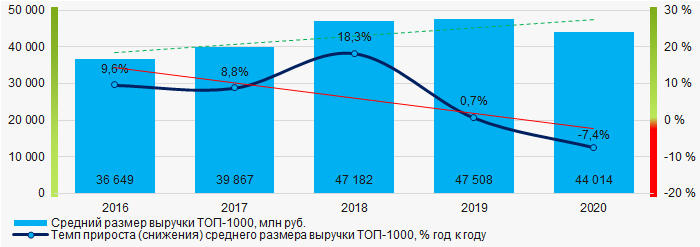 Picture 4. Change in average revenue of TOP 1000 in 2016 – 2020
Profit and loss
In 2020, the largest organization in term of profit was JSC Oil Company LUKOIL, INN 7708004767, Moscow, exploration geophysical and geochemical works related to mineral resources and the reproduction of the mineral resource base study. The company’s profit was 198 billion RUB.
For the five-year period there is a trend to decrease in average net profit of TOP 1000. It became more noticeable in 2020. (Picture 5).
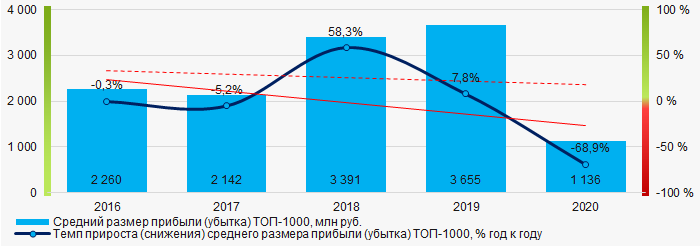 Picture 5. Change in average profit (loss) of TOP 1000 in 2016 - 2020
For the five-year period average net profit of TOP 1000 have a decreasing trend with increasing net loss (Picture 6).
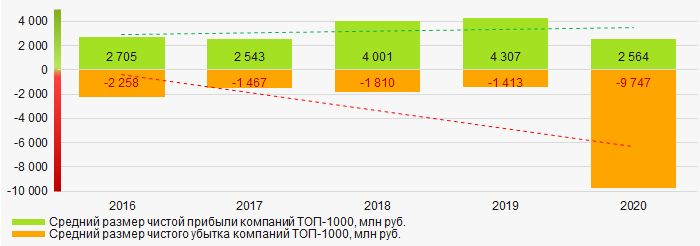 Picture 6. Change in average net profit and average net loss of TOP 1000 companies in 2016 - 2020
Key financial ratios
For the five-year period average values of current liquidity ratio of TOP 1000 were above the recommended one - from 1,0 to 2,0 with a trend to decrease. (Picture 7).
Current liquidity ratio (current assets to short-term liabilities) shows the sufficiency of company’s assets to repay on short-term liabilities.
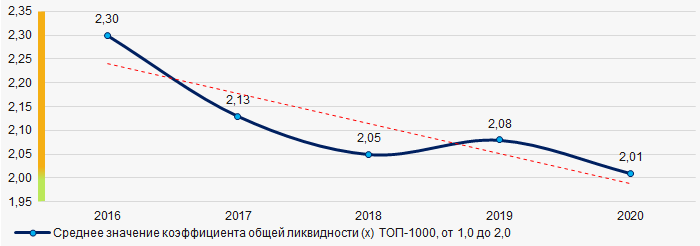 Picture 7. Change in average value of current liquidity ratio of TOP 1000 in 2016 - 2020
For the five-year period average values of ROI ratio of TOP 1000 showed increasing trend. (Picture 8).
ROI ratio is calculated as net profit to sum of shareholders equity and long-term liabilities, and shows the return of equity involved in commercial activities and long-term borrowed funds.
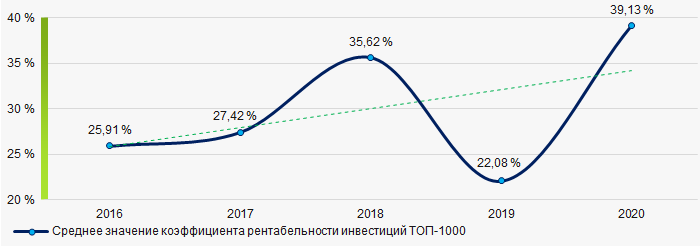 Picture 8. Change in average value of ROI ratio of TOP 1000 in 2016 - 2020
Assets turnover ratio is the ratio of sales revenue and company’s average total assets for a period. It characterizes the effectiveness of using of all available resources, regardless the source of their attraction. The ratio shows how many times per year the full cycle of production and circulation is performed, generating the corresponding effect in the form of profit.
For the five-year period average values of assets turnover ratio of TOP 1000 had a trend to decrease. (Picture 9).
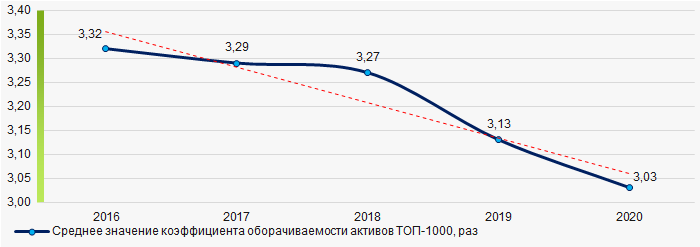 Picture 9. Change in average value of assets turnover ratio of TOP 1000 in 2016 – 2020
Small business
Only 7,5% of the TOP 1000 companies are registered in the Register of small and medium-sized enterprises of the Federal Tax Service of the Russian Federation. Moreover their share in total revenue of the TOP 1000 in 2020 is only 0,4% that is way below the average values over the country in 2018 - 2019. (Picture 10).
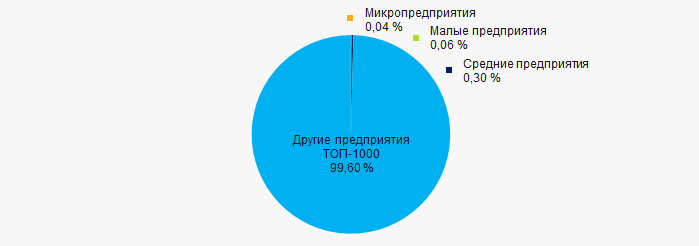 Picture 10. Shares of small and medium-sized enterprises in TOP 1000
Cities of activity
Distribution of revenue of the TOP 1000 companies shows, that more than 81% of the total volume accrue to Moscow and Saint Petersburg. (Picture 11).
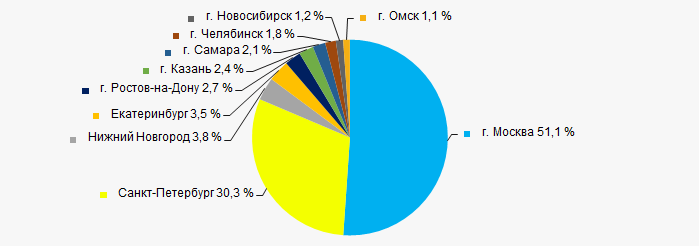 Picture 11. Distribution of TOP 1000 revenue by 10 largest cities of Russia
Financial position score
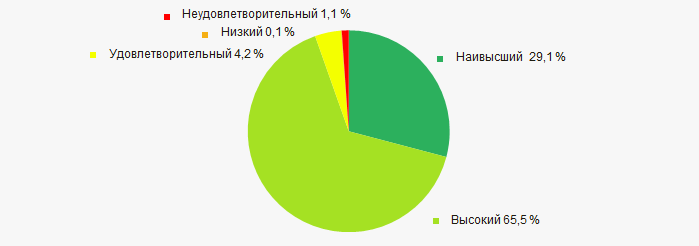
Assessment of the financial position of TOP 1000 companies shows that the majority of them have above average financial position (Picture 12).
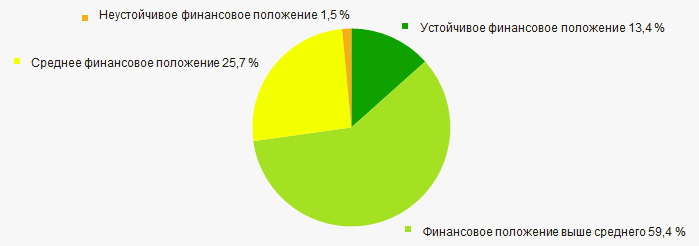 Picture 12. Distribution of TOP 1000 companies by financial position score
Solvency index Globas
Most of TOP 100 companies got Superior / High indexes Globas. This fact shows their ability to meet their obligations on time and in full (Picture 13).
 Picture 13. Distribution of TOP 1000 companies by Solvency index Globas
Conclusion
Complex assessment of activity of the largest companies of 10 cities with a million-plus population in Russia demonstrates the prevalence of negative trends in 2016 - 2020 (Table 1).
| Trends and evaluation factors | Relative share of factors, % |
| Dynamics of the average net assets value | |
| Rate of growth (decline) in the average size of net assets | |
| Increase / decrease in the share of enterprises with negative values of net assets | |
| Level of competition / monopolization | |
| Dynamics of the average revenue | |
| Rate of growth (decrease) in the average size of revenue | |
| Dynamics of the average profit (loss) | |
| Rate of growth (decrease) in the average size of profit (loss) | |
| Growth / decline in average values of companies’ net profit | |
| Growth / decline in average values of companies’ net loss | |
| Increase / decrease in average values of total liquidity ratio | |
| Increase / decrease in average values of return on investment ratio | |
| Increase / decrease in average values of asset turnover ratio, times | |
| Share of small and medium-sized businesses in terms of revenue being more than 20% | |
| Regional concentration | |
| Financial position (the largest share) | |
| Solvency index Globas (the largest share) | |
| Average value of relative share of factors | |
![]() positive trend (factor),
positive trend (factor), ![]() negative trend (factor)
negative trend (factor)