
Order a report
Custom-made industry research, company ratings, competitor analysis


ТOP 1000 vegetable wholesalers
The FAO Food Price Index grew by a third in a year. This is one of the highest rates for the last 40 years. By the end of the year the further increase in fruit and vegetable prices is expected and it will affect the state of affairs in the wholesale of these products. So far from 2011 to 2020 activity trends among the largest companies in this industry were mostly positive.
The most important of them are: high level of competition, growth in the size of revenue, growth in values of net profit and increase in values of ROI ratio, large share of the small business in the industry. Among negative trends there are increase in shares of the companies with insufficient property and high concentration of the companies in the capital regions.
For the analysis of the trend activities in this industry information agency Credinform в Системе Globas the largest fresh vegetable, potato, fruit and nut wholesalers (TOP 1000) with the highest annual revenue according to the data from the Statistical Register and the Federal Tax Service for the latest available periods (2011-2020).
Net assets are total assets less total liabilities. This indicator reflects the real value of the property of an enterprise. When the company’s debt exceeds the value of its property, the indicator is considered negative (insufficiency of property).
The largest company in terms of net assets is MUUP GORSNAB GO GOROD YAKUTSK, Republic of Sakha (Yakutia). In 2020 net assets of the company were 907 million RUB.
The lowest net assets value among TOP 1000 belonged to OOO NASH PLYUS, INN 7724319669, Moscow. Insufficient property figured out negative value -639 million RUB.
For the ten-year period the industry average net assets values tend to increase. (Picture 1).
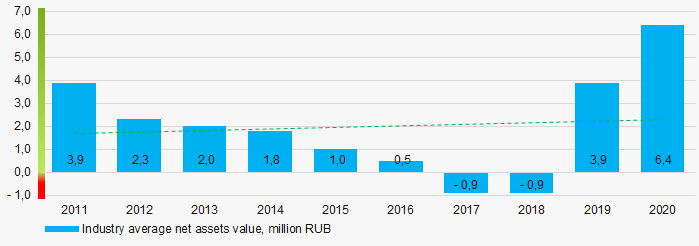 Picture 1. Change in industry average net assets value in 2011– 2020
Shares of the companies with insufficient property in TOP 1000 had a negative trend to increase for five years. (Picture 2).
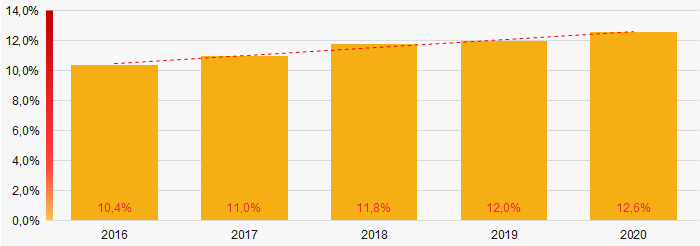 Picture 2. Shares of TOP 1000 companies with negative net assets value in 2016-2020
Sales revenue
In 2020, the revenue volume of the ten largest companies was almost 29% of total TOP 1000 revenue. (Picture 3). This indicates a relatively high level of competition among the companies in the industry.
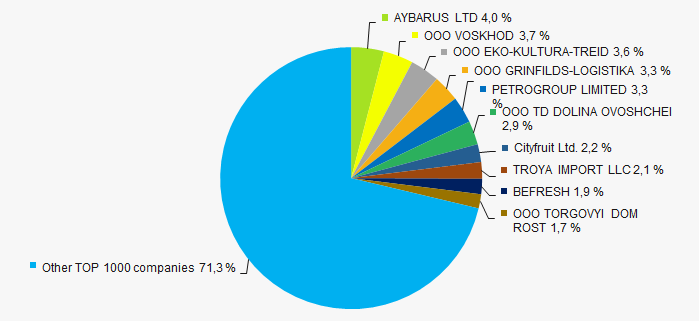 Picture 3. The share of TOP 10 companies in total 2020 revenue of TOP 1000
 For ten years industry average revenue values and rates of its growth increase with every year. (Picture 4).
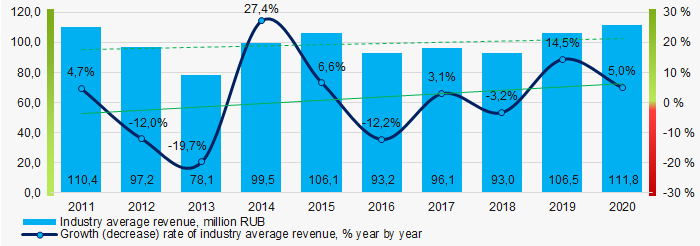 Picture 4. Change in industry average revenue in 2011 – 2020
Profit and loss
In 2020, the largest organization in TOP 1000 in term of profit was OOO GRINFILDS-LOGISTIKA, INN 7719894695, Moscow. The company’s profit was 423 million RUB.
Covering the ten-year period industry average profit values were at the low level and have a tendency to increase. (Picture 5).
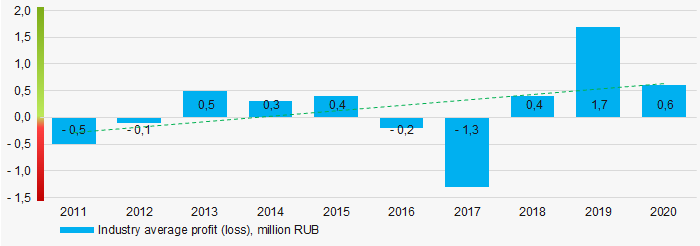 Picture 5. Change in industry average profit (loss) values in 2011 – 2020
For the five-year period average net profit and net loss of TOP 1000 companies have multidirectional increasing trends. (Picture 6).
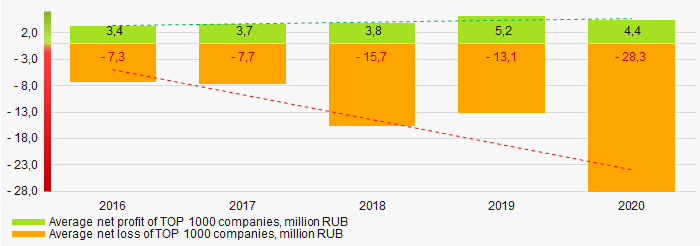 Picture 6. Change in average net profit and net loss of ТОP 1000 in 2016 - 2020
Key financial ratios
Covering the ten-year period, the industry average values of the current liquidity ratio were mostly within the recommended values - from 1,0 to 2,0 with a trend to increase. (Picture 7).
Current liquidity ratio (current assets to short-term liabilities) shows the sufficiency of company’s assets to repay on short-term liabilities.
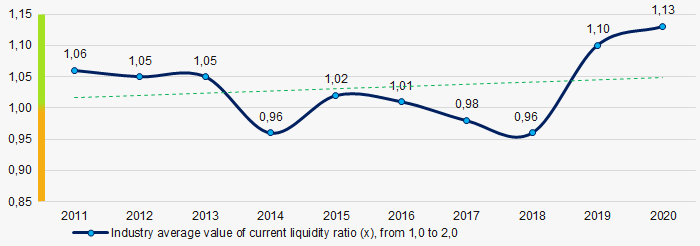 Picture 7. Change in industry average values of current liquidity ratio in 2011 – 2020
For the ten-year period industry average values of ROI ratio demonstrated the increasing trend. (Picture 8).
ROI ratio is calculated as net profit to sum of shareholders equity and long-term liabilities, and shows the return of equity involved in commercial activities and long-term borrowed funds.
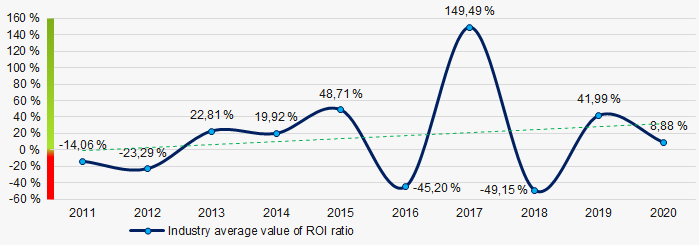 Picture 8. Change in industry average values of ROI ratio of TOP 1000 in 2011 - 2020
Assets turnover ratio is the ratio of sales revenue and company’s average total assets for a period. It characterizes the effectiveness of using of all available resources, regardless the source of their attraction. The ratio shows how many times per year the full cycle of production and circulation is performed, generating the corresponding effect in the form of profit.
Covering the ten-year period, this business activity ratio demonstrated the decreasing trend. (Picture 9).
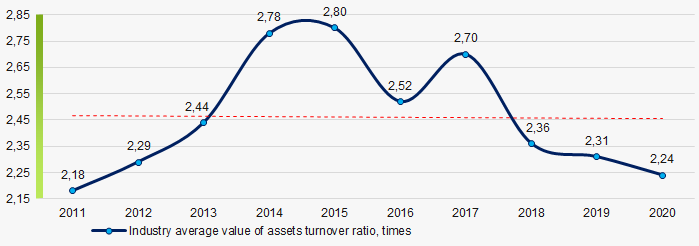 Picture 9. Change in industry average values of assets turnover ratio in 2011 – 2020
Small business
94% of ТОP 1000 companies are registered in the Unified register of small and medium-sized enterprises of the Russian Federal Tax Service. Herein, their share in TOP 1000 total revenue in 2020 is 49%, which is almost twice higher than the national average value in 2018 – 2019. (Picture 10).
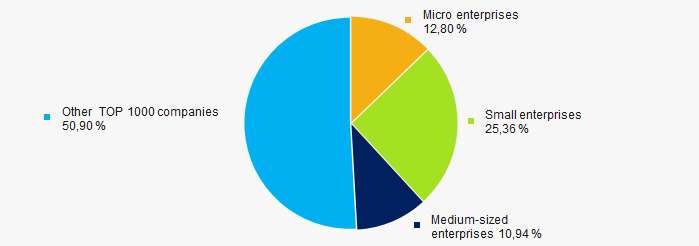 Picture 10. Shares of small and medium-sized enterprises in ТОP 1000
Main regions of activity
TOP 1000 companies are registered in 74 regions (87% regions of the Russian Federation) and are unequally located across the country. 53% of the largest companies in terms of revenue of TOP 1000 are located in two capital cities - Saint Petersburg and Moscow. (Picture 11).
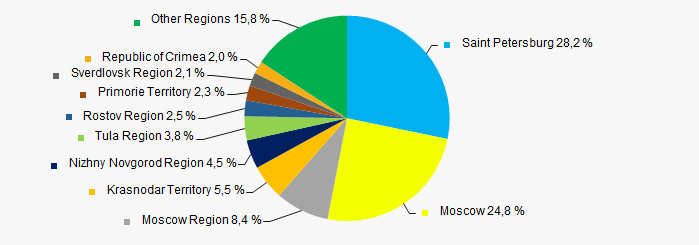 Picture 11. Distribution of TOP 1000 revenue by the regions of Russia
Financial position score
Assessment of the financial position of TOP 1000 companies shows that the financial position of the majority of them is average. (Picture 12).
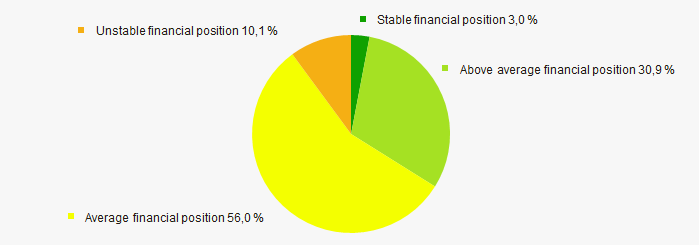 Picture 12. Distribution of TOP 1000 companies by financial position score
Solvency index Globas
Most of TOP 1000 companies got Superior/High and Strong/Medium indexes Globas. This fact shows their ability to meet their obligations on time and in full. (Picture 13).
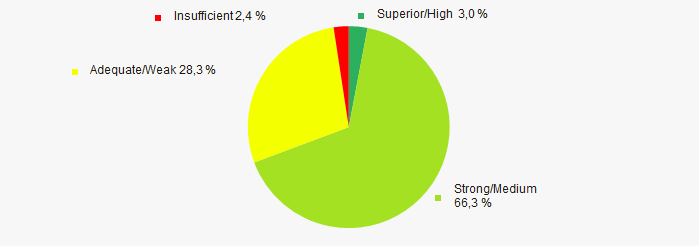 Picture 13. Distribution of TOP 1000 companies by Solvency index Globas
Conclusion
A complex assessment of activity of the largest fruit and vegetable wholesalers demonstrates the prevalence of positive trends in their activities in 2011-2020. (Table 1).
| Trends and evaluation factors | Relative share of factors, % |
| Dynamics of the average net assets value | |
| Increase / decrease in the share of enterprises with negative values of net assets | |
| Level of competition / monopolization | |
| Dynamics of the average size of revenue | |
| Rate of growth (decrease) in the average size of revenue | |
| Dynamics of the average values of profit (loss) | |
| Growth / decline in average values of companies’ net profit | |
| Growth / decline in average values of companies’ net loss | |
| Increase / decrease in average values of current liquidity ratio | |
| Increase / decrease in average values of ROI ratio | |
| Increase / decrease in average values of assets turnover ratio, times | |
| Share of small and medium-sized businesses by revenue more than 20% | |
| Regional concentration | |
| Financial position (the largest share) | |
| Solvency index Globas (the largest share) | |
| Average value of relative share of factors | |
![]() positive trend (factor),
positive trend (factor), ![]() negative trend (factor)
negative trend (factor)