TOP-10 COMPANIES OF RUSSIA ENGAGED IN TRADE OF METAL PRODUCTS
Steel is one of the most requested metal alloys in modern industry. Its` basic components are iron and carbon. Unique balance of hardness and plasticity made steel suitable for production of wide range of items, and large amount of iron ore, available for mining, made it widespread thanks to relatively low prime cost.
Global production of steel in 2019 made 1,9 billion tones, whereof Asian countries made 1,3 billion tones, including China – 1 billion tones, where about 53% of the global production is concentrated. In Russia steel production achieved 71,6 million tones or 3,9% of the global amount, our country takes 5-th place in terms of this indicator.
Milestone at steel market, as well as for other raw materials, is spreading trade warfare between the USA and other countries, including China. Drastic protective measures, imposed by the USA, became the reason of market volatility growth. Absence of clear prospects prevents companies from stable planning and investments in production. On the back of collapse of industrial production in the PRC and other countries caused by coronavirus pandemia, demand for steel will decrease. In this case, not only steel manufacturers, but also leading metal traders will be rebound.
About 40–45% of metal products is sold by metal traders of Russia, the rest amount is sold directly by steel manufacturers, including via online-platforms, whereas domestic consumption of steel products is estimated at 35 million tones, the same amount is supplied for export.
In table 1 the largest metal trading companies of Russia are presented. The analysis demonstrates that the market is not monopolized: many players exist with commeasurable indicators. Data of the latest available financial accounts show growth of annual revenue of leading metal traders on 20% at average. Taking into account recent events and current macroeconomic environment, position of trading houses will get worse because of decrease of demand for steel caused by oncoming global economic downtown.
| № | Company | Revenue, billion RUB, 2018, revenue growth | Net profit/loss, billion RUB, 2018 |
| 1 | JSC STROISERVIS | 97 913 +35% |
4 055 |
| 2 | JSC METALLSERVICE | 90 250 +16% |
2 061 |
| 3 | JSC STEEL PRODUCTION COMPANY | 81 212 +26% |
1 777 |
| 4 | LLC TRADING HOUSE MMK | 58 802 +26% |
29 |
| 5 | LLC MECHEL SERVICE | 57 596 +1% |
-549 |
| 6 | JSC EVRAZ METALL INPROM | 39 271 +19% |
1 090 |
| 7 | JSC METALLOTORG | 38 051 +27% |
1 297 |
| 8 | JSC SEVERSTAL DISTRIBUTION | 37 423 +25% |
1 415 |
| 9 | LLC METINVEST EURASIA | 36 855 +1% |
310 |
| 10 | LLC A-GRUPP | 35 160 +27% |
389 |
Trends in special construction
Information agency Credinform has prepared a review of trends of the largest Russian companies engaged in special construction.
The largest companies (TOP-100) in terms of annual revenue were selected for the analysis according to the data from the Statistical Register for the latest available periods (2013-2018). The selected companies are engaged in dismantling and demolition of buildings, preparation of building sites, electrical, plumbing, finishing, roofing and waterproofing, as well as installation of scaffolding and foundation construction, pouring concrete, stones and bricks laying, installation and assembly of building structures. The analysis was based on the data of the Information and Analytical system Globas.
Net assets are total assets less total liabilities. This indicator reflects the real value of the property of an enterprise. When the company’s debt exceeds the value of its property, the indicator is considered negative (insufficiency of property).
The largest company in term of net assets is JSC KURSK FACTORY OF LARGE-PANEL HOUSING CONSTRUCTION NAMED AFTER AFDERIGLAZOV, INN 4630005929, Kursk region. In 2018, net assets value of the company amounted to 15,2 billion RUB.
The lowest net assets volume among TOP-100 belonged to JSC RZDSTROY, INN 7708587205, Moscow. In 2018, insufficiency of property of the company was indicated in negative value of -4 million RUB.
Covering the ten-year period, the average net assets values have a trend to decrease (Picture 1).
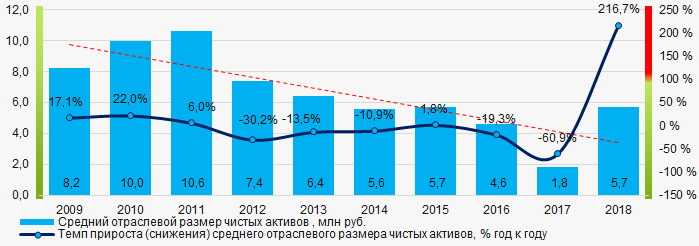 Picture 1. Change in average net assets value in 2009 – 2018
The shares of TOP-1000 companies with insufficient property have trend to increase over the past five years (Picture 2).
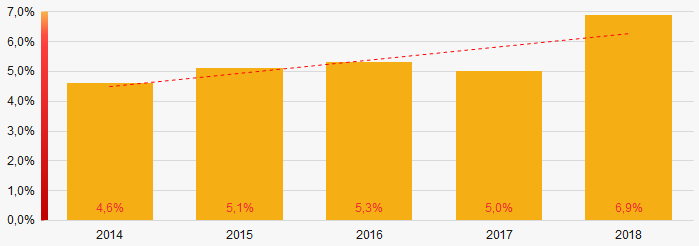 Picture 2. Shares of companies with negative net assets value in TOP-1000
Sales revenue
In 2018, the revenue volume of 10 largest companies of the industry was almost 26% of total TOP-1000 revenue (Picture 3). This is indicative of relatively high level of intraindustry competition.
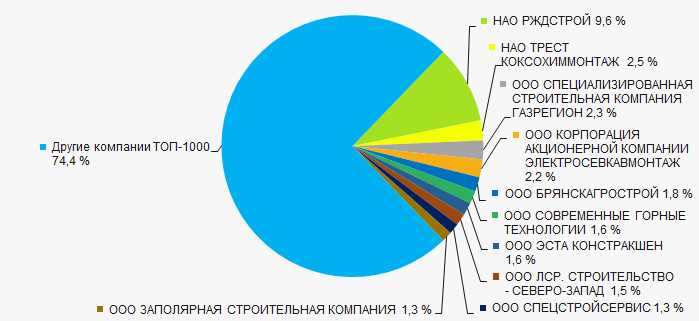 Picture 3. The share of TOP-10 companies in total 2018 revenue of TOP-1000
In general, there is a trend to decrease in revenue (Picture 4).
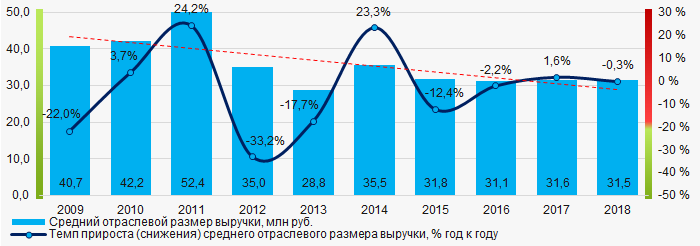 Picture 4. Change in industry average net profit in 2009-2018
Profit and loss
The largest company in term of net profit is LLC CORPORATION OF JSC ELEKTROSEVKAVMONTAZH, INN 2312065504, Krasnodar territory. The company’s profit for 2018 amounted to 1,9 billion RUB.
Over the five-year period, there is a trend to decrease in average net profit (Picture 5).
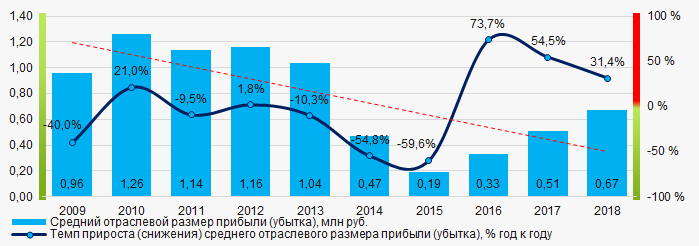 Picture 5. Change in industry average net profit (loss) values in 2009 – 2018
For the five-year period, the average net profit values of TOP-1000 companies are relatively stable with no clear trend. At the same time, the average net loss values have a decreasing trend (Picture 6).
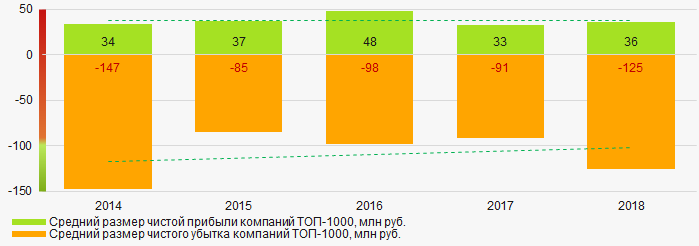 Picture 6. Change in average net profit and net loss of ТОP-1000 in 2014 – 2018
Key financial ratios
For the ten-year period, the average values of the current liquidity ratio were significantly above the recommended one - from 1,0 to 2,0 with a trend to decrease (Picture 7).
Current liquidity ratio (current assets to short-term liabilities) shows the sufficiency of company’s assets to repay on short-term liabilities.
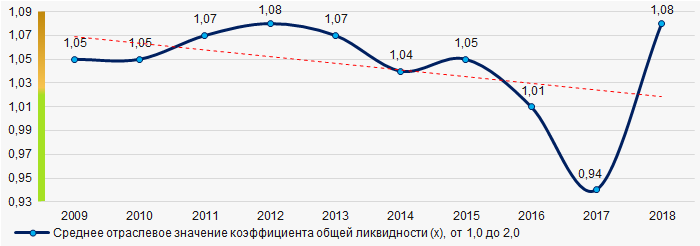 Picture 7. Change in industry average values of current liquidity ratio in 2009 – 2018
For the ten-year period, the average values of ROI ratio have a trend to increase (Picture 8).
ROI ratio is calculated as net profit to sum of shareholders equity and long-term liabilities, and shows the return of equity involved in commercial activities and long-term borrowed funds.
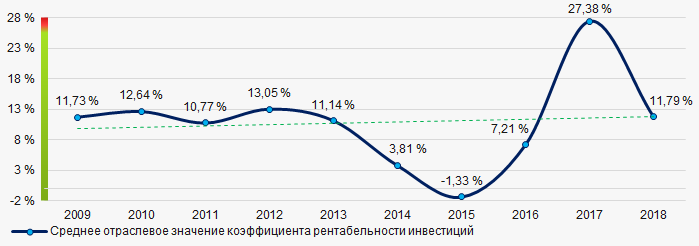 Picture 8. Change in average values of ROI ratio in 2009 – 2018
Assets turnover ratio is the ratio of sales revenue and company’s average total assets for a period. It characterizes the effectiveness of using of all available resources, regardless the source of their attraction. The ratio shows how many times per year the full cycle of production and circulation is performed, generating the corresponding effect in the form of profit.
For the five-year period, business activity ratio demonstrated the decreasing trend (Picture 9).
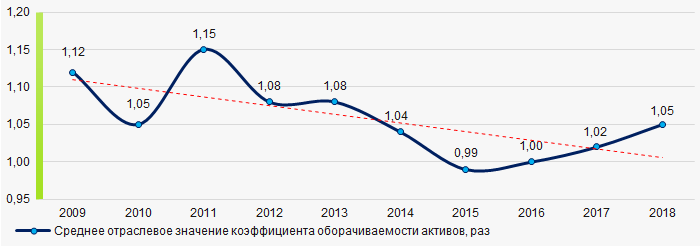 Picture 9. Change in average values of assets turnover ratio in 2009 – 2018
Small business
70% companies of TOP-1000 are registered in the Register of small and medium-sized enterprises of the Federal Tax Service of the Russian Federation. At the same time, their share in total revenue of TOP-1000 companies amounted to 25,9% that is higher than the national average figure (Picture 10).
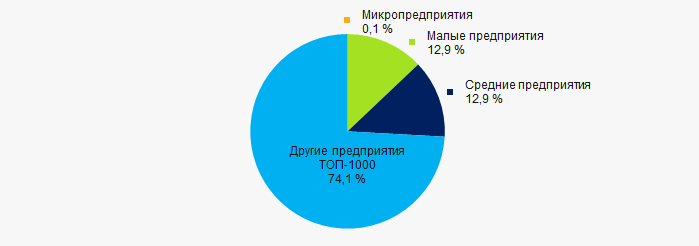 Picture 10. Shares of small and medium-sized enterprises in TOP-1000
Main regions of activity
Companies of TOP-1000 are registered in 71 regions of Russia, and unequally located across the country. Over 44% of companies largest by revenue are located in Moscow and Saint Petersburg (Picture 114).
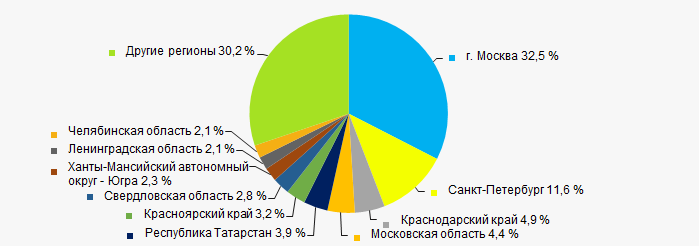 Picture 11. Distribution of TOP-1000 revenue by regions of Russia
Financial position score
Assessment of the financial position of TOP-1000 companies shows that the majority of them have financial position above average (Picture 12).
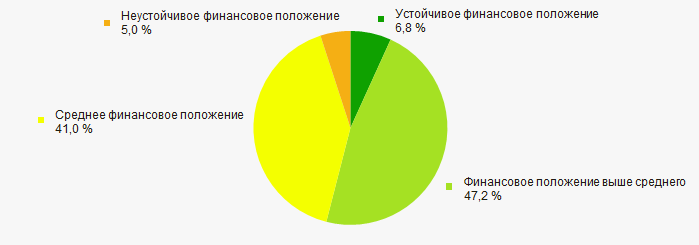 Picture 12. Distribution of TOP-1000 companies by financial position score
Solvency index Globas
Most of TOP-1000 companies got Superior / High and Strong / Medium index Globas. This fact shows their ability to meet their obligations fully (Picture 13).
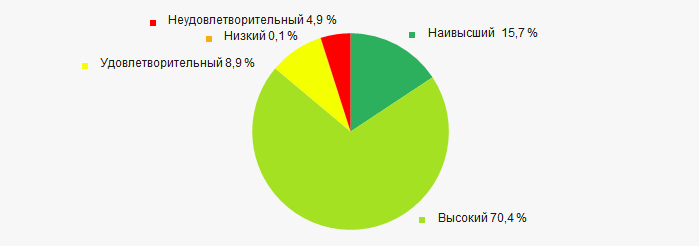 Picture 13. Distribution of TOP-1000 companies by solvency index Globas
According to the Federal state statistics service, the share of companies in total revenue from sales of goods, works and services was 0,56% for 2018, and 0,572% for 9 months of 2019. It is lower than the volume for the same period of 2018 with 0,827%.
Conclusion
Complex assessment of activity of the largest Russian companies engaged in special construction, taking into account the main indexes, financial ratios and indicators, demonstrates the prevalence of positive trends (Table 1).
| Trends and evaluation factors | Relative share of factors, % |
| Rate of growth (decline) in the average size of net assets |  -10 -10 |
| Increase / decrease in the share of enterprises with negative values of net assets |  -10 -10 |
| Level of competition / monopolization |  10 10 |
| Rate of growth (decline) in the average size of revenue |  -10 -10 |
| Rate of growth (decline) in the average size of profit (loss) |  -10 -10 |
| Growth / decline in average values of companies’ net profit |  5 5 |
| Growth / decline in average values of companies’ net loss |  10 10 |
| Increase / decrease in average values of total liquidity ratio |  -5 -5 |
| Increase / decrease in average values of return on investment ratio |  10 10 |
| Increase / decrease in average values of asset turnover ratio, times |  -10 -10 |
| Share of small and medium-sized businesses in terms of revenue being more than 21% |  10 10 |
| Regional concentration |  -10 -10 |
| Financial position (the largest share) |  10 10 |
| Solvency index Globas (the largest share) |  10 10 |
| Dynamics of the share of revenue in total revenue in RF |  5 5 |
| Average value of relative share of factors |  0,3 0,3 |
 positive trend (factor),
  negative trend (factor).