Changes in legislation
The Federal law of June 23, 2020 No. 187-FL entered into force, establishing the administrative liability of self-regulating organizations (hereinafter “SRO”) in the financial market for violations in monitoring the activities of its members, the procedure and deadlines for submitting information about SROs to regulatory authorities.
In particular, the law establishes that violations of the procedure for monitoring the activities of SRO members and the application of the power measures to them entail a warning or an administrative fine: from 10 thousand RUB to 50 thousand RUB for officials; from 50 thousand RUB to 200 thousand RUB for legal entities.
In addition, officials and legal entities are subjects to a warning or an administrative fine at the amount from 10 thousand RUB to 30 thousand RUB, and from 30 thousand RUB to 50 thousand RUB respectively for failure to present or violation of the order or deadlines for the submission of the following information:
- on changing addresses or locations of SROs, email addresses, contact phone numbers, addresses of official websites on the Internet;
- on changes in the statutes;
- on documents approved or adopted by the SRO governing the work of its specialized bodies.
Administrative fine may be paid in the amount of 50% of the amount if it is paid off no later than 20 days from the date of the decision.
In case of receipt of a copy of the decision on the imposing an administrative fine by registered mail after 20 days, this period may be renewed at the request of the court or the authority that made the decision.
According to the Central Bank of the Russian Federation, there are currently 24 operating self-regulating organizations in the financial market.
Economy in Saint Petersburg in crisis years
Information agency Credinform has prepared a review of the activity trends of the companies of real economy in Saint Petersburg during the financial crisis of 2008 – 2009 years.
The largest enterprises (TOP-1000) in terms of annual revenue were selected for the analysis according to the data from the Statistical Register for the period of 2006 – 2011 years. The analysis was based on the data from the Information and Analytical system Globas.
The number of active companies
From 2006 to 2011, the number of active companies increased, but the growth rates decreased especially during the acute phase of the crisis.
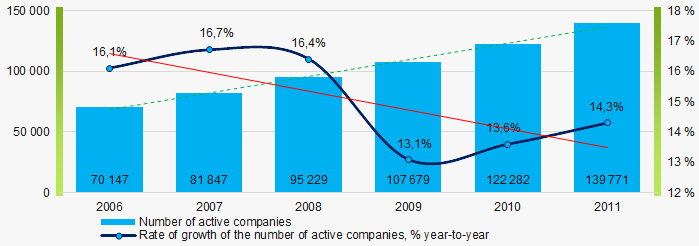 Picture 1. Change in the number of active companies in 2006 – 2011
Net assets are total assets less total liabilities. This indicator reflects the real value of the property of an enterprise. When the company’s debt exceeds the value of its property, the indicator is considered negative (insufficiency of property).
The largest company of real sector of economy in Saint Petersburg in term of net assets was LLC GAZPROM MEZHREGIONGAZ, INN 5003021311. In 2011, net assets value of the company amounted to almost 296 billion RUB. In 2018, the figure was almost 794 billion RUB.
The lowest net assets value among TOP-1000 was recorded for JSC PARNAS-M, INN 7830001250, in respect of which the bankruptcy case is considering, and the external management has been introducing since April 2, 2017. In 2011, insufficiency of property of the company was indicated in negative value of -359 billion RUB, and -664 billion RUB in 2018.
In 2006-2011, the average net assets values of TOP-1000 had a trend to increase, and the growth rates were significantly decreased during the acute phase of the crisis in 2008-2009 (Picture 2).
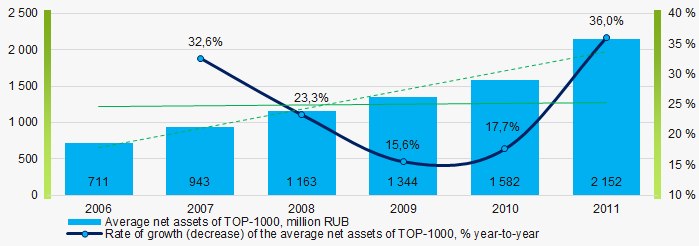 Picture 2. Change in average net assets value in 2006 – 2011
The shares of TOP-1000 companies with insufficient property have trend to increase in 2006-2011(Picture 3).
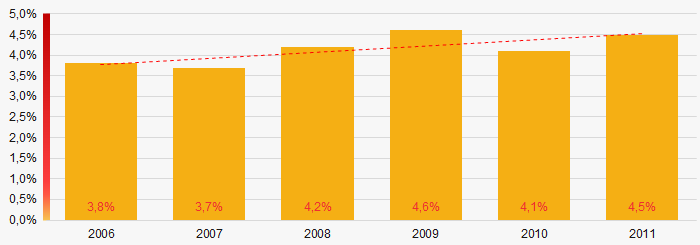 Picture 3. Shares of companies with negative net assets value in TOP-1000 in 2006 – 2011
 Sales revenue
The largest company of the real sector of economy in Saint Petersburg by revenue was JSC GAZPROM NEFT, INN 5504036333. The revenue volume exceeded 824 billion RUB in 2011, and almost reached 1810 billion RUB in 2019.
In general, there was a trend to increase in revenue with decreasing growth rate (Picture 4).
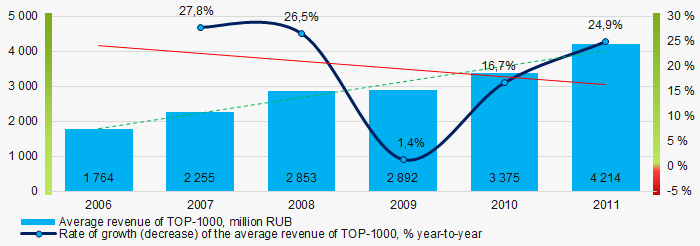 Picture 4. Change in average revenue in 2006 – 2011
Profit and loss
The largest company in term of net profit is JSC GAZPROM NEFT, INN 5504036333. The company’s profit exceeded 54 billion RUB in 2011, and almost reached 217 billion RUB in 2019.
During the period of 2006 – 2011, the average profit figures of TOP-1000 companies had a trend to increase with the significantly decreasing growth rates in 2008 (Picture 5).
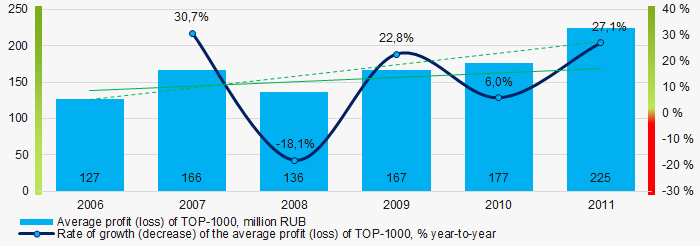 Picture 5. Change in average profit (loss) in 2006- 2011
In 2006 – 2011, the average net profit figures of TOP-1000 companies had a trend to increase with the increasing average net loss (Picture 6).
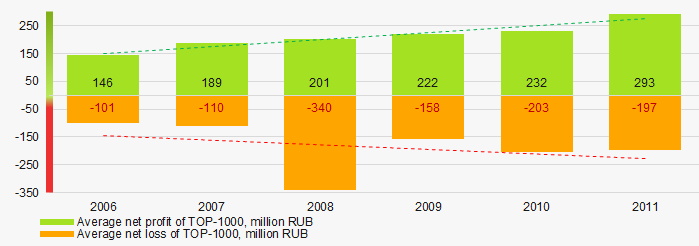 Picture 6. Change in average net profit and net loss of ТОP-1000 in 2006 – 2011
Key financial ratios
In 2006 – 2011, the average values of the current liquidity ratio were above the recommended one – from 1,0 to 2,0, with a trend to increase. (Picture 7).
Current liquidity ratio (current assets to short-term liabilities) shows the sufficiency of company’s assets to repay on short-term liabilities.
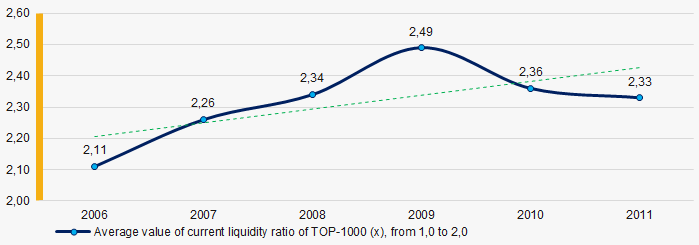 Picture 7. Change in average values of current liquidity ratio in 2006 – 2011
At the period of 2006 – 2011, there was a general trend to decrease in the average ROI values with a significant decline in 2008 (Picture 8).
ROI ratio is calculated as net profit to sum of shareholders equity and long-term liabilities, and shows the return of equity involved in commercial activities and long-term borrowed funds.
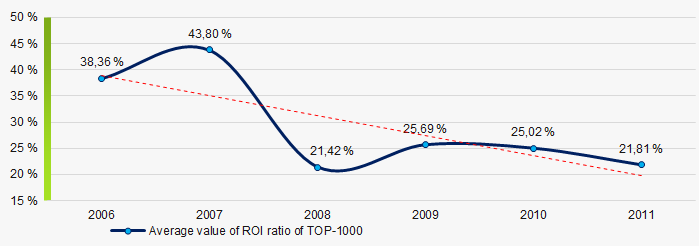 Picture 8. Change in average values of ROI ratio in 2006 – 2011
Assets turnover ratio is the ratio of sales revenue and company’s average total assets for a period. It characterizes the effectiveness of using of all available resources, regardless the source of their attraction. The ratio shows how many times per year the full cycle of production and circulation is performed, generating the corresponding effect in the form of profit.
In 2006 – 2011, there was a trend to decrease of this ratio (Picture 9).
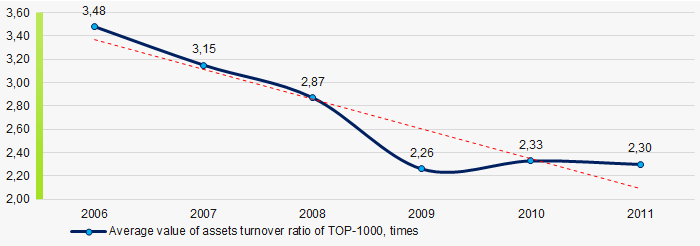 Picture 9. Change in average values of assets turnover ratio in 2006 – 2011
Small enterprises
43% companies of TOP-1000 are registered in the Register of small and medium-sized enterprises of the Federal Tax Service of the Russian Federation. However, their share in total revenue of TOP-1000 amounted 4,9% in 2011 (Picture 10).
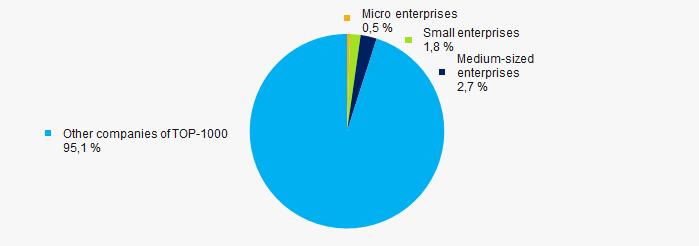 Picture 10. Shares of small and medium-sized enterprises in 2011
Financial position score
According to the assessment, the financial position of most of TOP-1000 companies is above average in 2020 (Picture 11).
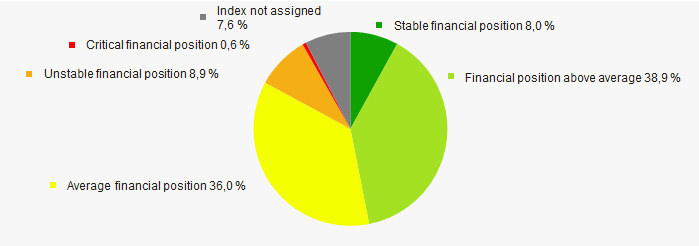 Picture 11. Distribution of TOP-1000 companies by financial position score in 2020
Solvency index Globas
In 2020, most of TOP-1000 companies got Superior / High and Strong / Medium index Globas. This fact shows their ability to meet their obligations fully and by the due date (Picture 12).
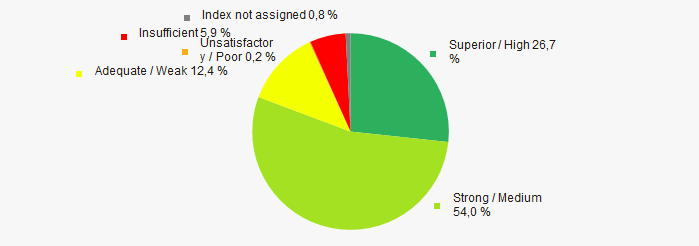 Picture 12. Distribution of TOP-1000 companies by solvency index Globas
Conclusion
Complex assessment of activity of the largest companies of real economy sector of Saint Petersburg, taking into account the main indexes, financial ratios and indicators, demonstrates the prevalence of positive trends in 2006 - 2011 (Table 1).
| Trends and evaluation factors | Relative share of factor, % | Possible forecast |
| Dynamics of the number of active companies |  10 10 |
|
| Rate of growth of the number if active companies |  -10 -10 |
During the acute phase of the crisis and the period of recovery, rate of growth of the active companies may be decreased |
| Dynamics of the average net assets value |  10 10 |
|
| Rate of growth (decline) in the average size of net assets |  10 10 |
During the acute phase of the crisis, rate of growth in the net assets may be decreased |
| Increase / decrease in the share of enterprises with negative values of net assets |  -10 -10 |
During the acute phase of the crisis and the period of recovery, the number of companies with negative values of net assets may be increased |
| Dynamics of the average revenue |  10 10 |
|
| Rate of growth (decline) in the average size of revenue |  -10 -10 |
During the acute phase of the crisis, rate of growth in revenue may be decreased |
| Dynamics of the average profit |  10 10 |
During the acute phase of the crisis, the average profit may be decreased |
| Rate of growth (decline) in the average size of profit (loss) |  10 10 |
During the acute phase of the crisis, rate of growth in average profit may be decreased |
| Growth / decline in average values of companies’ net profit |  10 10 |
During the acute phase of the crisis, net profit may be decreased |
| Growth / decline in average values of companies’ net loss |  -10 -10 |
During the acute phase of the crisis and the period of recovery, net loss may be increased |
| Increase / decrease in average values of total liquidity ratio |  5 5 |
|
| Increase / decrease in average values of return on investment ratio |  -10 -10 |
During the acute phase of the crisis and the period of recovery, return on investment ratio may by decreased |
| Increase / decrease in average values of asset turnover ratio, times |  -10 -10 |
Business activity may by decreased during the acute phase of the crisis, and will be slowly increased during the period of recovery |
| Share of small and medium-sized businesses in terms of revenue being more than 20% |  -10 -10 |
|
| Financial position (the largest share) |  10 10 |
|
| Solvency index Globas (the largest share) |  10 10 |
|
| Average value of relative share of factors |  1,5 1,5 |
 positive trend (factor),
  negative trend (factor).