
Order a report
Custom-made industry research, company ratings, competitor analysis


TOP-10 of recruiting agencies
Information agency Credinform has prepared a ranking of the Russian recruiting agencies. The largest enterprises (TOP-10 and TOP-100) in terms of annual revenue were selected according to the data from the Statistical Register and the Federal Tax Service for the available periods (2018-2020). Then the companies were ranged by profitability of sales ratio (Table 1). The analysis was based on the data from the Information and Analytical system Globas.
Profitability of sales (%) is the share of operating profit in the sales volume of the company. The ratio characterizes the efficiency of the industrial and commercial activity and shows the company’s funds, which remained after covering the cost of production, interest and tax payments.
The rage of ratio’s values within companies of the same industry is defined by the differences in competitive strategies and product lines.
The calculation of practical values of financial indicators, which might be considered as normal for a certain industry, has been developed and implemented in the Information and Analytical system Credinform by the experts of Information Agency Globas, taking into account the actual situation of the economy as a whole and the industries. The practical value of profitability of sales ratio for the recruiting agencies is from 0,62 to 17,56%%.
For the most full and fair opinion about the company’s financial position, the whole set of financial indicators and ratios of the company should be taken into account.
| Name, INN, region | Revenue, million RUB | Net profit (loss), million RUB | Return on assets, % | Solvency index Globas | |||
| 2019 | 2020 | 2019 | 2020 | 2019 | 2020 | ||
| 1 | 2 | 3 | 4 | 5 | 6 | 7 | 8 |
| LLC AVANTA SOLUTONS INN 7707309438 Moscow |
|
|
|
|
|
|
184 High |
| LLC EMPLOYMENT AGENCY MANPOWER INN 7714364630 Moscow |
|
|
|
|
|
|
229 Strong |
| BUSINESS PROCESS COMPANY LIMITED INN 7842450613 St.Petersburg |
|
|
|
|
|
|
228 Strong |
| HAYS SPECIALIST RECRUITMENT LIMITED LIABILITY COMPANY INN 7704720488 Moscow |
|
|
|
|
|
|
228 Strong |
| LLC MPH VOSTOK INN 7708650841 Moscow |
|
|
|
|
|
|
189 High |
| LLC BIN-PERSONAL INN 6376025977 Samara Region |
|
|
|
|
|
|
272 Medium |
| LLC COLEMAN SERVICES INN 5019016123 Moscow |
|
|
|
|
|
|
247 Strong |
| LLC GK CITY INN 1832145345 Udmurt Republic |
|
|
|
|
|
|
261 Medium |
| LLC Kelly Services CIS INN 7710284310 Moscow |
|
|
|
|
|
|
192 High |
| CITYSTAFF LLC INN 1659134777 Moscow |
|
|
|
|
|
|
266 Medium |
| Average value for TOP-10 companies | |
|
|
|
|
|
|
| Average value for TOP-100 companies | |
|
|
|
|
|
|
| Average industry value | |
|
|
|
|
|
|
![]() growth of indicator in comparison with prior period,
growth of indicator in comparison with prior period, ![]() decline of indicator in comparison with prior period
decline of indicator in comparison with prior period
In 2020, the average values of profitability of sales for TOP-10 companies is lower and for TOP-500 is higher than the industry average values, they are within the practical values. In 2020 and 2019, two and three companies respectively showed the negative results. In 2020, five companies demonstrated the decline in indicators, in 2019 there were seven companies like this.
At the same time, in 2020, five companies showed the increase in revenue and seven companies demonstrated the increase in net profit.
The TOP-10 average revenue increased by almost 20%, the decrease in TOP-100 ratio amounted to 2%, and the industry average value decreased by almost 23%
The TOP-10 average profit increased by 28%, TOP-100 by 41%, however, the industry average value decreased by 13 times.
In general, during the last 5 years, the growth of average industry indicators of profitability of sales ratio was observed twice. The ratio reached its highest values in 2018, and the worst result is shown in 2016 (Picture 1).
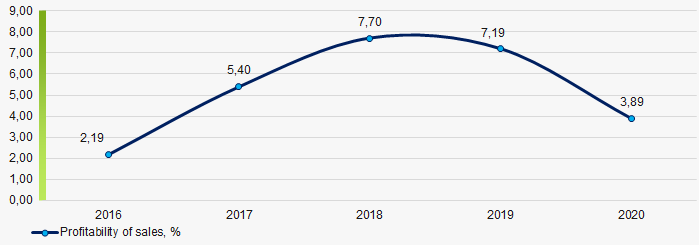 Picture 1. Change in average industry values of profitability of sales of the recruiting agencies in 2016 – 2020