
Order a report
Custom-made industry research, company ratings, competitor analysis


Return on sales of the largest Russian food retailers
Information agency Credinform prepared a ranking of the largest Russian food retailers. Companies with the highest volume of revenue (TOP-10) were selected for this ranking according to the data from the Statistical Register for the latest available periods (2016 and 2015). The enterprises were ranked by return on sales ratio (Table 1). The analysis was based on data from the Information and Analytical system Globas.
Return on sales (%) is calculated as a share of operating revenue in total sales of the company. Return on sales ratio indicates the efficiency of production and commercial activity, and shows funds volume resulting from sales of products after production costs, taxes and loan interests.
Difference in competitive strategies and product ranges defines the variety of return on sales of companies within the industry. That is why return on sales of two different companies at equal values of revenue, operating costs and profit before tax could vary influenced by interest payments on net profit value.
Taking into account the actual situation both in economy in general and in the sector, the experts of the Information agency Credinform have developed and implemented in the Information and Analytical system Globas the calculation of practical values of financial ratios, which can be recognized as normal for a particular industry. The practical value for food retailers in 2016 is up to 2,87%.
For the most complete and objective view of the financial condition of the enterprise it is necessary to pay attention to the complex indicators and financial ratios of the company.
| Name, INN, region | Net profit, mln RUB | Revenue, mln RUB | Return on sales, % | Solvency index Globas | |||
| 2015 | 2016 | 2015 | 2016 | 2015 | 2016 | ||
| 1 | 2 | 3 | 4 | 5 | 6 | 7 | 8 |
| LLC VKUSVILL INN 7734675810 Moscow |
278,3 | 432,6 | 5 585,6 | 18 052,5 | 3,95 | 7,10 | 218 Strong |
| LLC TAMERLAN INN 3442050010 Volgograd region |
563,1 | 670,4 | 19 233,9 | 19 533,9 | 3,02 | 2,63 | 180 High |
| LLC AGROASPEKT INN 7715277300 Moscow |
1 373,0 | 4 957,1 | 96 793,1 | 101 200,6 | 6,98 | 2,12 | 136 Superior |
| LLC COMPANY HOLIDAY INN 5406277570 Novosibirsk region |
241,4 | 25,9 | 58 781,2 | 56 469,2 | 1,61 | 1,35 | 235 Strong |
| LLC MAYAK INN 3811125221 Irkutsk region |
163,7 | 307,4 | 11 370,5 | 15 338,1 | 1,75 | 0,96 | 228 Strong |
| ОLLC TRADING HOLDING SIBIRSKIY GIGANT INN 5405289421 Novosibirsk region |
227,1 | 150,2 | 12 713,8 | 14 355,2 | -1,03 | 0,09 | 225 Strong |
| LLC SLADKAYA ZHIZN N.N. INN 5257041777 Nizhniy Novgorod region |
2 108,5 | 1 642,8 | 72 701,1 | 73 438,7 | -0,96 | -0,32 | 188 High |
| LLC INVESTPROEKT INN 5047081220 Moscow region |
15,3 | -260,4 | 13 370,5 | 12 829,6 | -2,64 | -0,64 | 320 Adequate |
| LLC BETA-M INN 7715437850 Moscow |
-21,9 | -12,2 | 2 689,7 | 11 970,1 | 0,75 | -1,70 | 316 Adequate |
| LLC ALBION-2002 INN 5257056036 Nizhniy Novgorod region |
-1 268,3 | -435,6 | 22 929,1 | 42 150,5 | -0,79 | -17,96 | 278 Medium |
| Total for TOP-10 | 368,0 | 747,8 | 31 616,9 | 36 533,8 | |||
| Average value for TOP-10 companies | 36,8 | 74,8 | 3 161,7 | 3 653,4 | 1,26 | -0,64 | |
| Average value for industry | 0,5 | 0,5 | 31,6 | 35,8 | 2,83 | 2,87 | |
Average value of return on sales ratio for the TOP-10 in 2016 is negative and lower than for the practical average. Two companies in TOP-10 have values higher than practical in 2016, four companies – lower, and four have negative values (marked with green, orange and red in columns 6 and 7 of Table 1 and on Picture 1 respectively). Six companies have reduced net profit or revenue figures in 2016 compared to the previous period, or have losses (filled with red in columns 3 and 5 of Table 1).
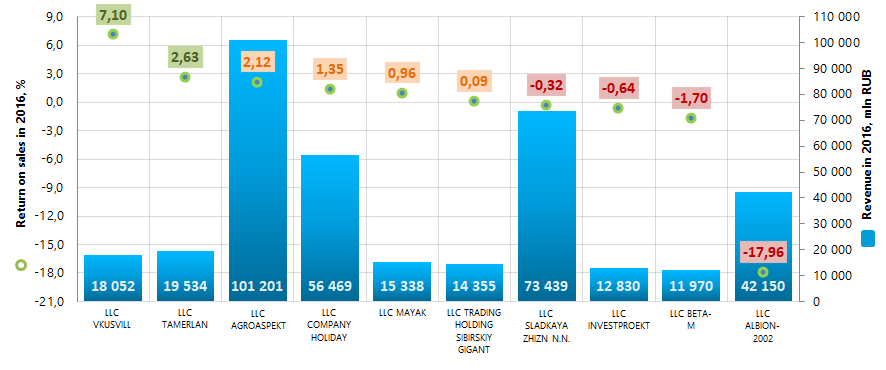 Picture 1. Return on sales ratio and revenue of the largest Russian food retailers (TOP-10)
The average industry indicators of return on sales ratio over the past ten years demonstrate instability. In 2009 and 2015, the indicators were below the practical value of 2016. This may indicate a certain decrease in economic efficiency in this area of activity during periods of crisis in the economy (Picture 2).
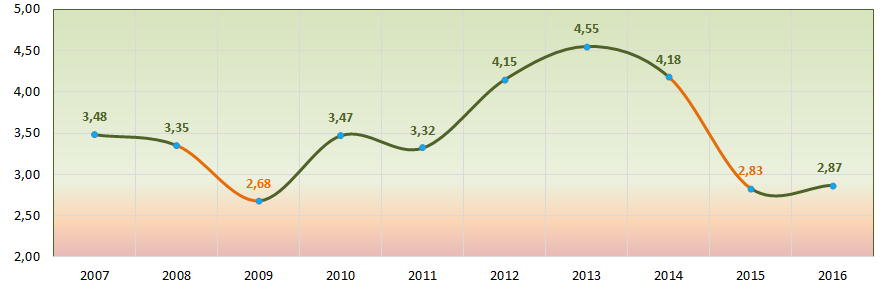 Picture 2. Change in average industry values of return on sales ratio of the Russian food retailers in 2007 – 2016
Eight companies in TOP-10 got high, strong, medium and superior indexes Globas that indicates their ability to timely and fully fulfill debt liabilities.
LLC INVESTPROEKT and LLC BETA-M has got adequate Solvency index Globas https://globas.credinform.ru/en-GB/home/auth due to the presence of information about participating as a defendant in arbitration cases, delays in implementation of liabilities and losses in balance sheet structure. Indexes development forecast is stable.
Moreover, following the results of the Federal Tax Service of the RF (FTS) check, LLC BETA-M has a record as of 21.08.2017 on unreliability of the legal address.